|
The idea for this is to make a lineup of players who for reasons other than just being really good (though that is entertaining, often), are a treat to watch. Rather than explain through examples, I'll just try to build a team here. There may be a second edition of retired players, but for now start here.
Current Players
0 Comments
Let's have a little fun here. This has been one of the best seasons for rookies in quite some time, and we could be looking back at some all-time talents in the future. Unlike in the last one, I won't pick on "worst of" for this category, it doesn't really seem sporting. Stats should be as of September 26, and we'll go top 3 this time.
American League - Position Player (minimum 300 PA)
Lindor
National League - Position Player (minimum 300 PA)
Kris Bryant should be the no-doubt Rookie of the Year, and may even get some down-ballot MVP votes. And why not? He has power, can field at multiple positions. Even the folks at MLB.com seem to agree. Some more award categories eventually, but I may do some other posts in the meantime as well. I was intending to do separate categories for the pitchers as well, but there are a lot that are really close together, and it's kind of drawing straws to come up with the candidates. For what it's worth, I think these should be the winners: AL - Lance McCullers (2.7 fWAR, 2.4 rWAR, 1.96 WARP- 114.2 IP, 3.22 ERA, 3.18 FIP) NL - Noah Syndergaard (3.0 fWAR, 2.0 rWAR, 2.45 WARP - 143.0 IP, 3.34 ERA, 3.28 FIP) By the way, all of the highlighted links are to videos, there are lots more of each player, I just chose a few highlights. See the last post on MVP for a bit of methodology, etc. Generally the Cy Young doesn't take team performance into account specifically, though in the past a lot of (read: too much) attention has been paid to Win-Loss record, which is a fairly team-oriented construct. Anyway, in the case of a need for tie-breaking, team performance or performance in important games might be considered.
American League
Price
Keuchel
Much like the AL MVP, this one is almost too close to call. Keuchel gets a little more love from some advanced stats especially because he's a groundball heavy pitcher. Price gets some more strikeouts, they both walk abotu the same number of guys, almost the same number of innings. They probably have two more regular season starts each, and that might make the difference. Price and the Blue Jays are fighting for the division, while Keuchel and the Astros are trying to hold onto the second Wild Card (though a strong finish could put them back in the division mix), but on the other hand, Keuchel has been with the Astros since opening day, while Price joined the Jays at the trade deadline. Right now, I'll say David Price based on his exceptional performance with the Jays, especially against the Yankees, but two more starts could legitimately change this. *Read Baseball Prospectus glossary here for information on some of their stats. Anthony Young Award (Famous for holding the Major League record by losing 27 consecutive decisions. Losses are overrated, but having the same last name as Cy makes this an easy choice. Minimum 80 IP here)
National League
Kershaw
Anthony Young Award (Famous for holding the Major League record by losing 27 consecutive decisions. Losses are overrated, but having the same last name as Cy makes this an easy choice. Minimum 80 IP here)
Funny (or sad if you're a fan of these teams) to note that on the "worst" list, some teams seem to have multiple offenders (looking at you Boston, Detroit and Milwaukee). Well, those were pretty good. Maybe it would have been worth waiting a week and a half for a little bit of finality (which 3 of the 4 awards so far may need), but there can always be an addendum at that point, plus then it will be time to talk about playoffs! Next, rookies! Well friends, it's that time again, when arguments about end-of-season awards start. I'm here to contribute to the arguing! But frankly, I don't find that much of it to be all that important. Just kind of fun.
Rather than have 1 colossal post with too much going on in it, I'll break it down into categories. - MVP of each league - Cy Young of each league - Rookie hitter and pitcher of the year per league - top hitter for each league - top reliever for each league. Plus, for each, I'll do the opposite: LVP, worst pitcher, worst full-time hitter, worst full-time reliever. - Silver Slugger equivalents - that is, top hitter (only) at each position for both leagues. Maybe the low end of that as well, for comparison. - Gold Glove equivalents - that is, top fielder (only) at each position for both leagues, plus their opposites. - All Star teams for each league for this season, plus the No Star teams. Probably add a All Rookie team to this as well. So here goes! MVP A lot of words are written each year on this subject, often focusing on just what "valuable" means. I tend to take a bit more of a literalist approach, which is to say, I don't really care how well your team did. Baseball being what it is, one player can only influence a team that much, and the old "how bad would this team be without him?" exercise, well not invaluable, discounts guys who play exceptionally with an otherwise poor team. That and, the very instructions for voting on the award say "don't worry about how the team did" (paraphrasing). But if two players are otherwise exceptionally close, it doesn't hurt to use something like that as a bit of a tie-breaker. With any of these categories, I will try to find supporting statistics from the three major WAR producers. -
For these major awards, I'll try to present the cases for the top 5 contenders and then select who I think should win (I have no influence on this, I am not a member of the BBWAA, and unless whoever is reading this has shared it with a lot more people than I know about, I'm guessing my readership is probably still in the single digits, but thank you all still! There are no ads on this blog right now because I'm doing this 100% for fun.) All Statistics are through September 24 - there are about 10 games left per team, so things could change, but shouldn't change a huge amount. American League
Donaldson
I present a lot of stats here because... well it's really close. Baseball Prospectus is the only site of the three that sees a significant gap between them. On the one hand, traditional narrative favours Donaldson, as his team looks like they'll be in the playoffs, and Trouts may not (but still have a slim chance at a wildcard). But on the other hand, the same narrative robbed Trout of deserved MVP awards in 2012 and 2013 when he was significantly more valuable by most measures than playoff-bound Miguel Cabrera. It would seem a little insane for a just-turned 24-year-old to have been the best player (or just about this year) in the league every year since he was 20 and come out of it with 1 MVP award in his worst season of the 4 and three second-place finishes in the other years. But it might happen. Trying to parse it a bit, Trout gets on base a bit more and hits for a bit more power despite playing more games in significantly tougher ball parks (6 point difference between the two). Two of the three sites see Donaldson as a better fielder, but the third gives Trout a strong advantage there. Donaldson leads in RBIs, but has also driven in a higher percentage of the runners who have been on base for him. Honestly, this one is so close as to make either choice completely defensible. As a fan of the Blue Jays (thought not an exclusive fan), I want to pick Donaldson. As a fan of baseball history, I want to pick Trout, because he may end up going down as one of the top 5 or so players in the history of the game, and we're getting to watch it happen. This year may be the only time that it is fair to use team record as a tiebreaker, so if the standings finish exactly as they are now, with Trout out and Donaldson in and the stats remain this close (neither one hits 10 home runs with a .700 average over the last week and a half of the season), I'd vote Donaldson. But honestly, it's about 51-49, maybe 52-48. LVP (at least 400 PA - I'll leave the pitchers for the next round) - "top" 3 only
National League
Quickly though, his ranks in BOTH leagues in the following categories: Avg (1st), OBP (1st), Slg (1st), Runs (2nd - by 1), WAR (1st - all 3), HR (3rd, 1st in NL), BB (2nd), Runs Created (1st), wOBA (1st), wRC+ (1st), ISO (1st),. This is not a difficult decision. Any articles written between now and when the awards come out that suggest otherwise are wrong. I don't mind saying (and other smarter writers than me have already said) that anybody who votes differently is wrong. Bryce Harper is the NL MVP this year. LVP (at least 400 PA - I'll leave the pitchers for the next round)
That's all for the MVP/LVP stuff. Next up will by Cy Young / Anthony Young. Because we're all starting to get excited about the Blue Jays possibly (even probably at this point) ending the 22 year playoff drought, I thought it might be fun to compare the 2015 team to their position counterparts from the 1992 or 1993 teams. I'll give total stats from all players who played that position (you can find such splits at Baseball Reference).
C - Russel Martin/Dioner Navarro vs Pat Borders 2015 - .242/.315/.426, 23 HR, 29 2B, 2 3B, 2 SB, 55 BB, 125 K 1992 - .233/.283/.373, 16 HR, 30 2B, 2 3B, 1 SB, 41 BB, 90 K 1993 - .253/.291/.383, 13 HR, 33 2B, 2 3B, 2 SB, 30 BB, 94 K 1B - Chris Colabello/Justin Smoak vs John Olerud 2015 - .248/.323/.493, 36 HR, 29 2B,1 3B, 2 SB, 60 BB, 153 K 1992 - .274/.359/.419, 18 HR, 31 2B, 0 3B, 1 SB, 81 BB, 76 K 1993 - .382/.483/.637, 29 HR, 55 2B, 3 3B, 2 SB, 112 BB, 71 K 2B - Devon Travis/Ryan Goins vs Roberto Alomar 2015 - .250/.323/.394, 13 HR, 35 2B, 0 3B, 7 SB, 53 BB, 105 K 1992 - .298/.389/.411, 8 HR, 31 2B, 8 3B, 50 SB, 90 BB, 63 K 1993 - .310/.389/.465, 17 HR, 36 2B, 6 3B, 55 SB, 81 BB, 77 K 3B - Josh Donaldson vs Ed Sprague/Kelly Gruber 2015 - .301/.369/.572, 39 HR, 42 2B, 2 3B, 7 SB, , 64 BB, 133 K 1992 - .230/.288/.373, 18 HR, 27 2B, 3 3B, 8 SB, 44 BB, 116 K 1993 - .261/.311/.385, 12 HR, 35 2B, 2 3B, 2 SB, 34 BB, 94 K SS - Jose Reyes/Troy Tulowitzki vs Manny Lee/Tony Fernandez & Friends 2015 - .269/.323/.384, 11 HR, 27 2B, 4 3B, 17 SB, 45 BB, 109 K 1992 - .258/.328/.311, 3 HR, 15 2B, 2 3B, 9 SB, 57 BB, 90 K 1993 - .264/.325/.359, 4 HR, 22 2B, 11 3B, 19 SB, 54 BB, 64 K LF - Ben Revere/Ezequiel Carrera vs Candy Maldonado/Rickey Henderson & Friends 2015 - .282/.323/.386, 11 HR, 27 2B, 0 3B, 10 SB, 35 BB, 120 K 1992 - .269/.349/.451, 22 HR, 31 2B, 5 3B, 4 SB, 67 BB, 133 K 1993 - .241/.331/.407, 20 HR, 30 2B, 5 3B, 27 SB, 79 BB, 108 K CF - Kevin Pillar vs Devon White 2015 - .261/.304/.382, 12 HR, 28 2B, 2 3B, 21 SB, 32 BB, 91 K 1992 - .251/.306/.392, 17 HR, 29 2B, 9 3B, 39 SB, 49 BB, 145 K 1993 - .274/.338/.432, 16 HR, 46 2B, 6 3B, 35 SB, 61 BB, 147 K RF - Jose Bautista vs Joe Carter 2015 - .251/.358/.489, 35 HR, 21 2B, 2 3B, 8 SB, 90 BB, 121 K 1992 - .289/.341/.520, 32 HR, 36 2B, 9 3B, 14 SB, 48 BB, 110 K 1993 - .222/.289/.397, 27 HR, 24 2B, 3 3B, 8 SB, 55 BB, 122 K DH - Edwin Encarnacion vs Paul Molitor/Dave Winfield 2015 - .295/.387/.551, 30 HR, 41 2B, 1 3B, 4 SB, 78 BB, 97 K 1992 - .267/.352/.465, 29 HR, 32 2B, 2 3B, 2 SB, 78 BB, 101 K 1993 - .308/.383/.471, 20 HR, 36 2B, 4 3B, 20 SB, 80 BB, 77 K Starting Pitchers 2015 - 67-40, 4.00 ERA, 905.0 IP, 614 K, 258 BB, 107 HR, 1.271 WHIP, ~4.04 FIP 1992 - 74-54, 4.09 ERA, 1037.2 IP, 638 K, 379 BB, 96 HR, 1.302 WHIP, ~4.07 FIP 1993 - 70-50, 4.63 ERA, 999.1 IP, 649 K, 432 BB, 103 HR, 1.456 WHIP, ~4.34 FIP Relief Pitchers 2015 - 19-25, 31 Sv, 3.39 ERA, 440.1 IP, 427 K, 119 BB, 49 HR, 1.136 WHIP, ~3.32 FIP 1992 - 21-12, 49 Sv, 3.46 ERA, 403.0 IP, 316 K, 162 BB, 28 HR, 1.330 WHIP, ~3.54 FIP 1993 - 25-17, 50 Sv, 3.30 ERA, 442.0 IP, 374 K, 188 BB, 31 HR, 1.371 WHIP, ~3.50 FIP Obviously 2015 is not complete, but with 11 games left, it gives a decent enough comparison. Thoughts, position by position. C (2015) - Pat Borders holds a special place in nostalgic Jays fans' hearts, but Russell Martin is pretty clearly better than either version (and by defensive estimates, quite a bit better). Can he heat up in the playoffs the way PB did? 1B (1993) - Interesting comparing between 2015 and 1992, as this year's version has more power with less on base ability. Both get destroyed by 1993 led mostly by John Olerud's league-high marks in batting average, OBP and slugging percentage. 2B (1993) - Even with Devon Travis healthy, there was no way that a Hall of Fame player in his prime wasn't going to be quite a bit better. Both Alomars were pretty great, though he picked up the rate stats a bit in 1993 for probably his best. 3B (2015) - A similar runaway to first base, Josh Donaldson is a leading MVP candidate. Sprague and Gruber, eh... not so much. SS (push) - With a healthy Troy Tulowitzki all year, 2015 probably takes it relatively easily. But going by the actual stats, there's not a lot to push one year ahead of another. Tulo, Fernandez and Lee are / were all pretty good fielders. This year's iteration is able to hit more long balls. LF (1992) - The first win for the first squad, led by the Candy Man, this is a pretty solid line overall. CF (1993) - 1992 and 2015 are almost strikingly similar, and Kevin Pillar is putting up great defensive numbers. Devon White at that period was (and still is) seen as one of the best center field defenders of all time. And his offense picked up in 1993, so he looks like the best. RF (1992) - This is close between 1992 and 2015, but I'll give the first team a win again on the strength of that 520 slugging percentage. Nostalgia for Carter aside though, that OBP is not mostly him, as he contributed a characteristically weak .309 that year. Dave Winfield chipped in enough in 26 games out there that the stats get bumped up. DH (2015) - I really thought this would go to 1993 with Paul Molitor placing second in the batting race and getting significant MVP support. But 2015 numbers are better in multiple areas. Offense overall - Pretty close. 2015 and 1993 each lead at 3 positions, 1992 leads at 2, and one gets a rough tie. SP (2015/1992) - Tough to call, both are in not especially run-scoring environments, both added a big-name pitcher later in the season (Price, David Cone). The 1992 team was able to beat out the young stars in Atlanta in the World Series, so if I had to pick based on a tie-breaker, they might get it, but we still have playoffs to go here. RP (1993) - Definite loss in the SP for this group, but the bullpen helped hold them together a lot of the time. The current team has a big lead in strikeouts, but that's a league-wide thing at that point. Among starting pitchers, there isn't that much of a difference. So what does it all mean? In another way to look at it, the 2015 Jays are 1st in the American League in Runs Scored, Avg, OBP, Slg, HR, BB, and 5th in SB. The 1992 Jays, not as known for their offense, were 2nd in Runs Scored, 5th in Avg, 6th in OBP, 1st in Slg, 2nd in HR, 6th in BB, and 7th in SB. The 1993 Jays were 2nd in Runs Scored, 1st in Avg, 3rd in OBP, 1st in Slg, 6th in HR, 7th in BB, and 1st in SB. This years team is more of an offensive juggernaut than either of the other two were, though the 1993 team was closer. Pitching-wise, the 2015 Jays are 4th in the league in ERA, 1st with fewest BB allowed, 8th in HR allowed, 12th in strikeouts, and have a 95 ERA- with a 4.06 FIP. The 1992 Jays were 9th in ERA, 7th in BB allowed, 6th in HR allowed, 2nd in strikeouts, and had a 96 ERA- with a 3.80 FIP. The 1993 Jays were 5th in ERA, 13th in BB allowed, 4th in HR allowed, 2nd in strikeouts, and had a 97 ERA- with a 4.13 FIP. All three teams had some strengths and weaknesses pitching wise. I can't predict the future (and if I could, I could probably make good money off of it), but the comparisons to those World Champions of the past are fun, if nothing else. - Clayton Kershaw - 30th lowest FIP since 1915. 6th lowest last year. A chance to be only the 4th pitcher with a FIP below 2.00 more than once (Sandy Koufax 1963 & 1965; Walter Johnson 1915-1917, Pete Alexander 1915 & 1917). Of note, Kershaw and Koufax both call / called Dodger Stadium home (though Koufax had some more extreme conditions), and Johnson and Alexander, well, over 1915-1917, exactly one player hit more than 20 home runs in a full season, and exactly one other hit more than 15. Those were both in 1915. 1916 and 1917 had nobody hit more than 12.
- Bryce Harper - His season isn't over yet, but among players under 25, Fangraphs currently puts him as having 20th best season of all time, with some time to climb that charts. By the way, among players still under 25, the 9th and 10th best seasons of all time belong to one Mike Trout in 2012 and 2013. If you go offense only (using wRC+), he climbs to 6th all time under 25. - Jake Arrieta - This came up today. After again allowing 0 runs (for the 7th time since the All-Star game), his second half ERA is down to 0.86. It is the lowest ever for the second half of a season with 13 or more starts. Nobody else has ever been below 1.00. He's having a heck of a year, though value suggests that he's still no Kershaw, and nobody is. - Mike Trout - It's always something with him. Here's a career stat, for a young guy. This is his age-23 season (he turned 24 in August, but age is counted as of June 1). He has accumulated the most WAR of any player by age 23 (37.3 and counting in 4 and a bit seasons). That's ahead of Ted Williams, Ty Cobb, Mel Ott, Mickey Mantle... and, well, everybody. - Chris Sale - His strikeout per 9 inning rate of 11.97 is currently the 9th best over a full season in history. Ahead of him are Randy Johnson 6 times, Pedro Martinez and Kerry Wood once each. - Aroldis Chapman - Similarly, his strikeout per 9 inning rate of 15.97 so far is the 5th best rate in history for a reliever, with a chance to climb to 4th or 3rd. He still trails the record by a decent amount, set by Aroldis Chapman, 2014. Since reaching the major leagues, Chapman has struck out 43.0% of all batters he has faced, the best of any reliever since 1915. The only other guy to pass 40% is Craig Kimbrel. For some additional fun, the leaderboard of fastest individual pitches is so one-sided at the top (there's literally one name on it), that they went ahead and created a "Chapman Filter" to give some other people a chance. - All rookies - A lot has been written about how good this years rookies have been. Among position players, there are already 7 who have accumulated over 3 WAR, led by nearly 6 from Kris Bryant. Going with an arbitrary cutoff of 1986 (30 seasons), 84 rookies accumulated over 3 WAR, or just under 3 per season, so this is pretty good. Kris Bryant is pretty close to being one of the 5 best rookies of the last 30 years, in particular. - Playoff Possibilities - Probably anybody reading this blog is well aware that the Blue Jays have not been to the playoffs since Mitch Williams threw that last pitch to Joe Carter back in 1993. That is now the longest playoff drought in the 4 major North American sports, though 22 years since a title is far from the longest, particularly among the current probable playoff participants. Quickly: Toronto Blue Jays - Last playoffs, 1993. Last title, 1993. New York Yankees - Last playoffs, 2012. Last title, 2009. Kansas City Royals - Last playoffs, 2014. Last title, 1985. Texas Rangers - Last playoffs, 2012. Last title, never (franchise started in 1961). Houston Astros - Last playoffs, 2005. Last title, never (franchise started in 1962). New York Mets - Last playoffs, 2006. Last title, 1986. St Louis Cardinals - Last playoffs, 2014. Last title, 2011. Pittsburgh Pirates - Last playoffs, 2014. Last title, 1979. Chicago Cubs - Last playoffs, 2008. Last title, 1908. Los Angeles Dodgers - Last playoffs, 2014. Last title, 1988. So of the probable playoff participants, it turns out that only two have won the World Series more recently than Toronto. Of course those 2 have combined to win 38 of 110 World Series titles, so they're often in the mix. That being said, go Jays. The last post on basic stats ended up being longer than I might have first planned, but it was fun to say some things about them anyway. In any case, I'm going to go lighter on advanced stats because they're harder to explain in some cases, and more details are already available by the people who created them in most cases. But a few of them are particularly useful, and I might throw them around when comparing players, so it's worth quickly explaining what they are, and why use them, and what some good numbers are. As mentioned previously, most information is likely to come from Fangraphs because they tend to go deep on a lot of things.
WAR - Wins Above Replacement. This stat has caused some confusion over the years since it came into existence, and is sometimes mocked by "old-school" types. At its core, I think it's a really good stat. What it attempts to quantify is how many Wins a player is worth to his team vs a replacement level player - probably an average bench player or starter from the AAA minor league level. For position players, they try to quantify their offensive, defensive and baserunning value, with appropriate adjustments based on position (for example, a first baseman who produces identical numbers offensively to a shortstop will be less valuable because more first basemen are good at hitting). Catchers have their defense quantified differently (and more on that later). Pitchers are mostly evaluated just on their pitching. There is a lot of math that goes into this calculation, and it is calculated differently by the three major statistical websites: Fangraphs, Baseball Reference, and Baseball Prospectus. The differences are seen most often among the pitchers, and feel free to read up on differences. The shortest version of that difference is that Fangraphs calculates performance based on what the numbers say should have happened (more on that in FIP), where BR looks more at what did happen with weight put into what "should have". Sound confusing enough? There are umpteen articles written on this subject and whether it is good, bad, or otherwise. Let's go short though: higher WAR values are better, BUT there is enough adjustment needed in the data that it is not advised to make much of decimal differences. For example, a player seen to have 5.6 WAR might have been a bit better than one with 5.4, but they're realistically too close to accurately tell the difference. The 5.6 guy has probably performed at a considerably higher level than somebody with a 3.4 WAR, however. Also, it is a cumulative stat (some discussed later will be rate stats). That means that playing all year gives more value than missing a lot of time. A good starting pitcher who pitches 200 innings is probably going to be a good 2-3 times more valuable than a reliever who performs the same over 70-80 innings. There is also discussion each year over how much "one win" is worth on the free agent market. Fangraphs breaks this down slightly more, but look at it this way: Less than 0: probably going to get replaced (or should) 0-2: Relief pitcher, possibly 5th starter, bench guy or role player 2-4: Solid starting player. 4-6: All-star type player 6 and above: MVP contender (or Cy Young). For further reference, a team at 0 WAR by Fangraphs calculations should win about 48 games out of 162 (.294 winning percentage). Which is terrible. So you need approximately 33 WAR among your players to get to .500, about 42 to get to 90 wins (and a probable playoff spot), and 52 would make you a 100-win team (which are few and far between). Fore more reference, the Blue Jays have about 30 wins from their position players, and 14 from their pitchers. The WAR calculation says they should be about 85-55. The standings say 86-64. All in all, not bad. OK, that was a lot on the first thing. The rest will be quick, promise. Offense OBP - On Base Percentage - fixes a lot of what's wrong with batting average. In simplest terms, it is how many plate appearances end up with the batter on base (not giving them credit for getting on base when it caused somebody else to be forced out on the bases though, for example). An OBP of .400 means you reached base in 40 percent of your plate appearances. Below .300 is very bad, .300-.333 is just playable if you have power and/or defense, .333-.367 is adequate, .367-.400 is good to very good. Above .400 is excellent, and there are rare birds who clear .500 (and one man, one year, who cleared .600. That's not a typo). Slugging Percentage - Same problems as batting average in terms of "hits" and "at bats", but gives increased credit for power. That is, it's "total bases" divided by "at bats". Values of up to 4.000 are possible (though never achieved outside of a single game, obviously). Below about .350 is not good, .350-.400 is ok depending on other factors, .400-.450 is pretty good, .450-.500 very good, above .500 pretty excellent. The same man who cleared .600 in OBP cleared .800 in this stat twice. He is one of only two players to ever do so. OPS* - On Base Plus Slugging. An early attempt at an advanced stat added the last two together. There are two major problems with this: 1) they don't have the same denominator, and 2) it pretty heavily underrates on base percentage, which is generally more valuable than slugging. But people like it because it is a bit helpful I guess. Again, below .600 is bad, .600-.700 is probably a role player, .700-.800 ranges from average to above average, .800-.900 is pretty excellent, and above .900 could get you some MVP votes. wOBA - Weighted On Base Average - A long equation which attempts to properly do what the above one does by giving some weight to extra base hits, and these weights change slightly depending on the offensive environment of the season. The values you want are pretty much like the OBP ones (though you won't generally see any .600s). wRC and wRC+ - Weighted Runs Created and adjusted wRC. Again some gory math, but this one basically uses wOBA from above to estimate how many runs a players offense created compared to the league and replacement level, also taking into account the stadium they play most of their games in (park factors, see below). From WAR, 10 runs is worth roughly 1 win. The wRC+ formula (and other similar ones like OPS+) basically compares the wRC to the league average. Which is to say, a value of 100 means exactly average, 150 means 50% better than average, 200 (rare) means twice the average. ISO - Isolated Power. Simple stat subtracts batting average from slugging percentage to look just at the extra bases a batter got. Higher means more power. Below .100 is bad, .100-.150 is below average, .150-.200 is good to very good, .200-.250 is great, and above is pretty exceptional. BABIP - Batting Average on Balls in Play. If you remember from last section, we expect that most balls that are put in play will turn into hits about 30% of the time. In play in this case does not mean home runs, strikeouts, walks, being hit by a pitch. A player with an number well above .300 may be due for regression down, and one well below .300 may be due for regression up. There are hitters though who show consistent ability to have high numbers here due to speed, hitting a lot of line drives, and so on. There is a lot more that can go into that, but that's a good high level view of it. Note that a lot of this is true for pitchers too, though they tend to be less able to be way off the average than some hitters. RC - Runs Created - Joe Posnanski again takes a deep dive on this one, but basically Bill James came up with this about 40 years ago, and it still works pretty well. The basic formula is [(H+W) * (TB)] / (AB + W). It will be a similar number to wRC, but without the weighting for the run environment and all of that. On a macro level (and stats like these are great), Joe notes that " if you go back to 1950, the basic runs created formula has estimated that 1,126,591 runs would be scored. And, over those 65 years, teams have actually scored just 3,695 more runs than that" which gives it an accuracy of about 99.5%. Defense UZR - Ultimate Zone Rating. Combines a bunch of factors to show how many runs a player saves or gives up compared to a replacement player at their position. Most values range between -15 and +15, and the loosest breakdown suggests that -15 to -5 is very bad to below average, -5 to +5 is around average, +5 to +15 is above average to very good, and above +15 is excellent. DRS - Uses some different measures and weights to measure basically the same thing as UZR, and with the same breakdown of tiers, basically. Catcher Framing - A fun thing to measure, but a good argument for the need for automated umpiring. Heavy research in the age of high definition video and pitch F/X and the like have shown that some catchers are able to get strikes that the average catcher would have called a ball, and some go the other way and actually cost some strikes. The value of additional strikes seems to be huge, and is an argument for catchers having pretty immense value, but maybe a false one. The king of this is Jose Molina. Pitching FIP - Fielding Independent Pitching. As mentioned a couple of times, it's now believed and mostly accepted that pitchers don't have much control over balls in play. This weights their home runs, walks, and strikeouts, then adds a factor to make the number pretty close to ERA. Numbers that are good and bad are basically the same as ERA, something to look at is how it compares to their ERA. If it is a lot higher, then their "peripherals" (you may hear that a lot) suggest that their ERA is going to get worse. If it is a lot lower, then it suggests the opposite. xFIP - Expected FIP. Similar to above, but looks at fly ball rate. This basically expects that giving up more fly balls will mean more home runs, so it changes the home run value based on how many fly balls the pitcher gives up. This should be close to their FIP, but if not, it may be because the pitcher is giving up very few home runs per fly ball, or more than expected. LOB% - Percentage of runners left on base. Pretty much what it sounds like. If a guy gets on base, how well did the pitcher keep him from scoring. League average is usually around 70-72%, and significant deviation from this often suggests that they will regress. Caveats are that pitchers that get a lot of strikeouts may be naturally above this level, and pitchers that are "not major league caliber" may just be naturally below this level. HR/FB - Home runs per fly ball. Another that's pretty much what it sounds like. This can be affected by the park the pitcher pitches in, and there are a very (very) few pitchers that seem to be better or worse than expected at this. Average tends to be in the range of 10%, but there are some guys who outperform that. ERA- and FIP- - Basically what wRC+ and OPS+ do, but the opposite because for these stats, less is more. An ERA- of 75 is 25 percent better than league average, 100 is league average, etc. SIERA - Skill Interactive ERA. A fairly new one from Fangraphs, attempts to improve on FIP and xFIP by integrating things like ground ball rate, fly ball rate, and so on. The scale is pretty similar again to FIP and ERA, below 3 is good, above 5 is bad, below 2 is excellent. The math is long and gory, but if you see it, just look at the overall number and compare it to ERA. The bottom line is, a lot of these statistics are trying to show how well a player has performed "skill-wise", focusing on process vs results. And by looking at the process and comparing to the results, we might get an idea of what future results will be, better or worse or roughly the same. Multi-Area WPA - Win Probability Added. Over the many thousands of games that have been played, many many individual situations have occurred in terms of scores, baserunners and outs. In any situation, a team has a certain likelihood of winning the game. Any change in the situation changes this probability, and the pitchers and hitters who contribute are credited accordingly. Here's an example situation (all numbers made up). Score is tied 3-3 with nobody out in the top of the 5th inning. Both teams currently have a 50% chance of winning. The first batter hits a home run to give his team a 4-3 lead. Now with a 4-3 lead, nobody out, nobody on base, top of the 5th, his team has a 60% chance of winning. He gets +0.100 WPA, and the pitcher gets -0.100 WPA. Watching the graphs on Fangraphs shows the swings that can happen in games. The changes tend to be much more extreme the later the game gets if the scores are close. This stat is not predictive, but it does give a good idea of what happened. Park Factors - Mentioned a bit in the stadium post. Basically, different stadiums for different types of hitters and different types of hits. Heavy sea air may make fly balls not fly as far, short right field walls may make more home runs for left-handed hitters, etc. The park factors are usually weighted on a 100 scale, so that any park factor of 100 is exactly average, 110 is 10% above average, 90 is 10% below average, and so on. Taking a look at team statistics with this in mind can give a better idea of what their players are actually doing. RE24 - Run Expectancy with 24 base-out states. Basically there are 24 different states that the bases and outs can be in (ranging from 0 out, 0 on to 2 out, 3 on and every possibility in between). Based on the league environment, each of these states has a different number of expected runs going forward (based on the thousands of games that have come before, mostly). There are various stats that are based on performance with these states in mind. Quick example: 0 on, 0 out expects about 0.46 runs. 0 on, 1 out expects about 0.24 runs, dropping by 0.22. Runner on 1st, 0 out expects about 0.83 runs, going up about 0.37 runs. Overall, the swing between getting the leadoff runner to first base or him being out changes that inning by about 0.6 runs. Leverage Index - From Fangraphs, and using a couple of the recent stats: "You take the current base-out state, inning, and score and you find the possible changes in Win Expectancy that could occur during this particular plate appearance. Then you multiple those potential changes by the odds of that potential change occurring, add them up, and divide by the average potential swing in WE to get the Leverage Index." Relief pitchers tend to be used in higher leverage situations if they are of high quality, because managers tend to want them in tough situations. Well that's all for now. Probably a lot to read, but if you like it, it could be useful later. Because I am the way I am and I enjoy stats and analysis, I feel like it's worth giving a bit of a primer on some of the stats that I'm likely to refer to. I do this mostly because my very limited audience of friends and family may not know or care nearly as much about most of these as I do, but if I'm throwing them into things I write, it may be helpful to know what the heck I'm talking about.
For more full detail about advanced player stats, if you want to go deep, check out Fangraphs especially, though Baseball Reference, Baseball Prospectus, and others are good for information. I put that there because if you want to dive deep, that's where you should go instead of me re-hashing it. I just want to quickly explain some of the more useful or at least more frequently used ones. Also note, I'll reference Joe Posnanski a lot. He writes exceptionally well about many sports and a lot that isn't about sports, and a lot of my information and perspective has been influenced by his writing. If you want to dig deeper on something, read him. The man can really write. Also read or follow Grant Brisbee, Keith Law, Joe Sheehan, Rany Jazayerli, and Jonah Keri. First - Baseball Card Statistics For a long time, the stats that most fans and even sportswriters used were basic ones that showed up in newspaper box scores or on the back of baseball cards. A couple of these are useful, many are really not. I'll give a quick rundown of what and why. These are also commonly used in simple scoring system fantasy sports leagues. Hitters HR - Home runs. Nothing wrong with this as a statistic. Not always anything predictive, but with a few exceptions, it's counting balls that are hit over the fence. For most of the period between 1920 and 2015, more than 20 is pretty good, more than 30 is very good, more than 40 is great, and more than 50 is exceptional. The period of about 1996-2006 skewed these results a bit, as there were 18 players to reach 50 home runs vs 18 in the 75 seasons before and 4 in the almost 9 seasons since. With modern players in the last 10 years, there are statistics available including percentage of fly balls that become home runs and breakdowns into categories of No Doubt, Just Enough, or Lucky, even looks at how many stadiums under non-windy conditions a ball hit at a certain speed and angle would have actually been a home run in. This, for example, would normally have been a home run in 0. This one might have left Yellowstone. R - Runs scored. For an individual player, this is borderline useless. Don't believe what old-school announcers and writers might say. This is so much a function of who bats behind the hitter and under so little control for the hitter. On balance, a player who gets on base more (more on that later), may score more runs. A player who hits home runs is at least guaranteed to score 1 run per home run. Runs scored means a lot as a team statistic, and next to nothing as an individual one. Quick illustration by way of digression #1 - Player A hits a single. Player B grounds into a forceout. Player C hits a home run. Player B gets a run scored. What did he do besides erase player A? RBI - Runs Batted In. Kind of the same but opposite as above. The only guaranteed way to get an RBI is to hit a home run. But due to an arcane rule, there is actually a way to knock in a run that does not get you an RBI. If a run scores when you ground into a double play, they do not award the RBI. On a fly ball out or a single-out groundout, yes. Basically, players who hit a lot of home runs tend to get more RBI, because they're at least guaranteeing one per home run. But it's so much a function of how many runners are on base when they bat. Clutch hitting has been largely disproven with a very very few players who are probably outliers. Most players are as good in one situation as they are in another given enough opportunities. After all, they're all professionals. In both runs and RBI, the magic number seems to be 100. SB - Another counting stat. This one is fun but not all that meaningful. When power was lower in the 1970s and 1980s, stolen bases were very popular as a way to get into scoring position. As home runs went up, they became less popular, because you don't want to risk getting thrown out when anybody after you could hit a home run. Go look at Rickey Henderson's career stats for some fun times. Nowadays probably stealing more than 30 bases in a season will get you noticed as a pretty fast guy. In any case, pitchers and catchers pay more attention to this now than they used to, but players are also more careful about when they run, so overall opportunities are down in general. There is something of a break-even rate at around 70% success where a player should or should not try to run. If he is successful more than that, he is generally helping his team. If he is not, he is generally hurting his team. This relates to run expectancy, more on that later. AVG - Still popular, definitely overrated. The chief problem with this is what it does and doesn't count. It is a simple measure of the percentage of at bats that end with the player getting a hit. But to paraphrase Bill Clinton, a lot of that depends on what your definition of the word "is" is. A hit is: a single, double, triple or home run. A hit is also: a single where you get thrown out running to second, a double where you get thrown out running to third. A hit is not: a walk, getting hit by a pitch, , a sacrifice fly, a bunt, or reaching base when a fielder misplayed the ball in the eyes of the official scorer (errors - yes, they're subjective, but like Clarence Thomas, we often know them when we see them). An at bat is: something ending in a single, double, triple, home run, strikeout, ground out, or fly out unless that fly ball scores a run, an unsuccessful sacrifice bunt, or a time when you reached base when the fielder misplayed the ball (see just above). An at bat is not: something ending in a walk, being hit by a pitch, a successful sacrifice bunt, a sacrifice fly. For more analysis, Joe Posnanski writes about this (and most things) much better than I can right now, but another quick digression may help with the point. Player A - comes to the plate 20 times. He hits 2 home runs (2-run and 3-run), 1 single, 6 walks, 1 sacrifice fly, 4 strikeouts, 3 groundouts, 2 flyouts, and 1 time reached on an error. Player B - comes to the plate 20 times. He hits 6 singles, has 0 walks, 4 strikeouts, 6 groundouts, 4 flyouts. Batting average says Player A hit .231, and Player B hit .300. Sounds simple, right? On base percentage (coming later) will suggest that Player A made 11 outs (it's also not sure how to deal with errors, but there are further advances on that), while player B made 14. If you're hearing debate about it, the most basic levels are this: less than .200: unplayable. .200-.250: you'd better be a very good fielder or have lots of power. .250-.300: solid enough at most fielding, speed, or power profiles. .300-.350: very good (though as above, can be empty). .350 and above: probably having a pretty great season. Pitchers W - Wins. Again, read Joe Posnanski for further analysis (he also is probably where I picked up the A vs B comparison). But the problem with wins and losses attributed to pitchers especially in the modern game is that they're very incomplete. To win a game as a starting pitcher, you have to complete at least 5 innings, and finish pitching or be replaced with your team holding the lead, and they have to keep that lead. To lose a game, you have to have given up the run that gave the other team the lead that they did not relinquish. Samples below: Player A - 9 innings, 2 hits, 1 run, 10 strikeouts. Team scores 0 runs. Player A gets the L. Player B - 5 innings, 12 hits, 7 runs, 5 walks, 1 strikeout. Team scores 12 runs. Player B gets the L. Player C - 8 innings, 2 hits, 0 runs, 12 strikeouts. Leaves with his team holding a 3-0 lead. His replacement allows 3 runs to blow the save (oh we'll get there), but holds the tie. His team scores a run to win in the bottom of the 9th. His replacement gets the win. Player C gets nothing. Player D - enters the game in the 6th inning with the score tied and with 2 outs, throws 1 pitch to get the out. Team scores 5 times in the next half inning, and a new pitcher comes in, and his team wins. Player D's one pitch earns him the win. There are dozens of examples like this, but just take some time to consider it I guess. One last point is that attributing wins and losses to a pitcher made sense in the early days of baseball when most pitchers completed most of their games. Now most pitchers go around 6 innings for many (increasingly intelligent, but still occasionally flawed) reasons. People who like these stats count 20 in a season as being an accomplishment, and 300 in a career as being hall-of-fame worthy. Sv - Saves. This was a stat created by sportswriter Jerome Holtzman in 1959. It's not bad in and of itself, but it doesn't mean a lot. And it has some weird quirks to it. Per Wikipedia, a save is earned when: "He satisfies one of the following conditions: He enters the game with a lead of no more than three runs and pitches for at least one inning. He enters the game, regardless of the count, with the potential tying run either on base, at bat or on deck. He pitches for at least three innings." A note, some fun can be had with the last condition in there. The Littleton was coined when Wes Littleton earned a save for "preserving" the lead for 3 innings in a game with a final score of 30-3. To be fair to him, when he entered, the score was "only" 14-3. Closers and specialized bullpens started to ramp up in the mid-1980s with Tony La Russa, and now many teams carry at least 7 relief pitchers for reasons which may be ranted about at a later date. Again from Mr. Posnanski though, we find that this has made little to no difference. From his story, these are winning percentages of teams that have led going into the 9th inning in different decades: 1950s - .948 1960s - .946 1970s - .948 1980s - .951 1990s - .949 2000s - .954 2010s - .952 Read that last link to really go in depth. The big problem with saves is that it pigeonholes pitchers and managers. They decide that certain pitchers, their "closers", can only pitch in the 9th inning with a lead. If a more important situation comes up in the 7th or 8th, or if the game is tied in the 9th, somebody else will have to do it, nevermind if your "closer" is your best pitcher in the bullpen. Most pitchers who can last the whole season in a "closer" role will probably pick up at least 30 saves. K - Strikeouts - These are fine, though kind of cumulative. If you pitch 160 innings you'll probably have less strikeouts than if you pitch 200 innings or if you get to 240 innings. Strikeouts have also been going way up in recent years as pitchers pitch with maximum effort for shorter periods of time, and batters have realized that strikeouts are ok if swinging hard may net them more hard contact when they do get it. Percentage of batters struck out or strikeouts per 9 innings gives a bit more of a complete picture, but over a full season, looking at two pitchers who threw the same number of innings with very different numbers of strikeouts will at least tell you something. Most relievers now can get over 1 strikeout per inning, and some starters get that high as well. Over 200 in a season is pretty good, and it's been a while since anybody hit over 300. ERA - Earned Run Average. The first one involving some more math, the basic formula is 9 times number of earned runs divided by innings pitched, which simplifies to number of earned runs per 9 innings pitched. This stat is ok, but has a couple of flaws. The first is the "earned" portion. The link in the Wins section goes into some detail about the foolishness of errors, but the gist is that if a runner reaches base or scores because of what the scorer deems an error, it "doesn't count" to the pitcher. The second is that it doesn't account for bullpen usage in particular. If a pitcher loads the bases, gets two outs, and leaves for a relief pitcher, various things can happen. 1 - The replacement gets the next batter out. No earned runs for anybody. 2 - The replacement allows a triple, then gets the next batter out. 3 earned runs for the first pitcher, none for the replacement. And so on. A slightly simpler version would be RA or RA9 as it's sometimes called, which just charges the runs, earned or not, to the pitcher, but again this doesn't figure out that last situation. There are statistics that do, but not for this section. Also in a future section, I'll talk more about FIP, or fielding-independent pitching. The gist is that Voros McCracken, a baseball researcher, discovered that by and large, a pitcher can only really control 3 things: strikeouts, walks, and home runs. There turns out to be a little bit more to it, but not a lot. By and large, ball put in play (that is not one of those situations) will on average be a hit around 30% of the time. Knuckleballers seem to get around that a bit, some guys do a bit worse, and some guys do a bit better for various reasons (hitters seem to have some more variance here over their careers, and guys who allow more ground balls or fly balls will have some different results). There's a lot more to explore there. So I won't for this particular section. Simple levels again: below 2.00 is excellent; 2.00-3.00 is very good. 3.00-4.00 is fine for a starter, getting to be less fine for an important reliever. 4.00-5.00 is tolerable for a 4th or 5th starter or a mopup guy in the bullpen. Above 5.00 is probably going to be an issue going forward. WHIP - Walks + Hits per Inning Pitched. An early "advanced" stat that was created a bit more for fantasy leagues, the formula is entirely in the name. For the reasons just mentioned, it's not always greatly predictive (the hits part anyway), but it will probably tell you a good amount about the results that have happened, including ERA. Below 1.00 is pretty exceptional. 1.00-1.20 is very good, 1.20-1.40 is in the average range. 1.40-1.60 is pretty below average. Higher than 1.60 will probably get you in a lot of trouble. Next time, I'll try some advanced stats out. For now know that these are still talked about pretty commonly, but fortunately a lot of TV broadcasts and most websites go further than this, so I will next time as well. By request of Joel, let's try to pick out an interesting feature of each MLB stadium. For purely physical dimension information of the ballparks, click here. For no particular reason, I'm going by division, just to put in separators. For information about park factors, check these out, and then I won't rehash too much.
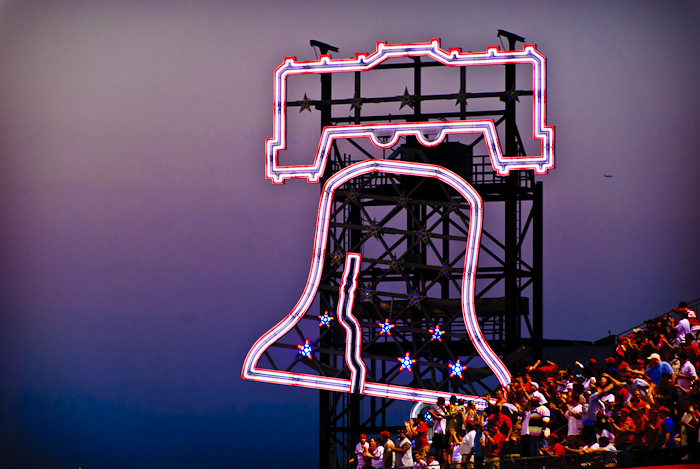
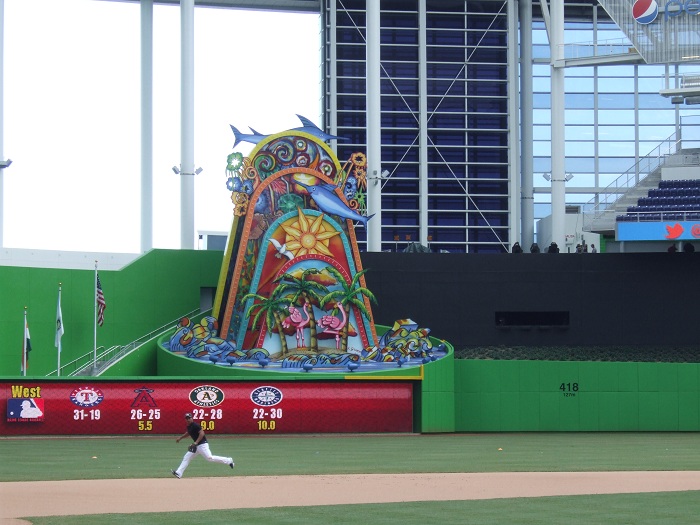
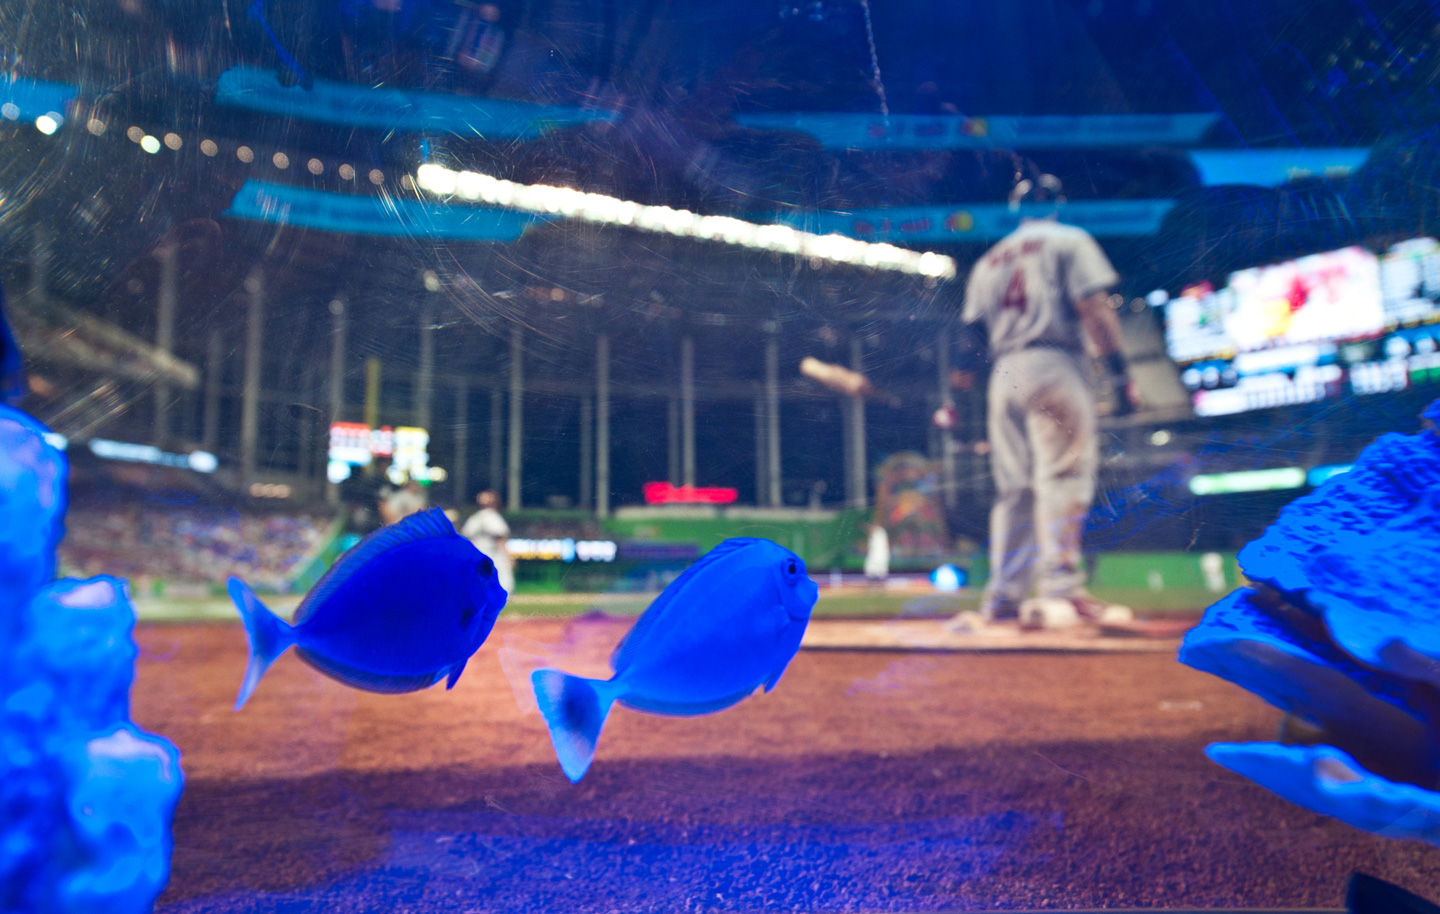
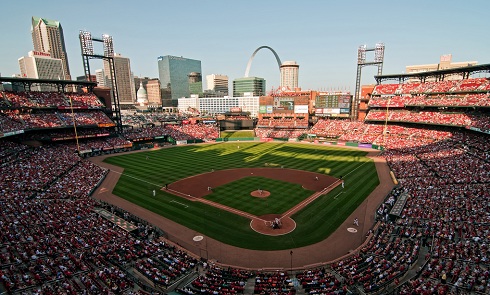
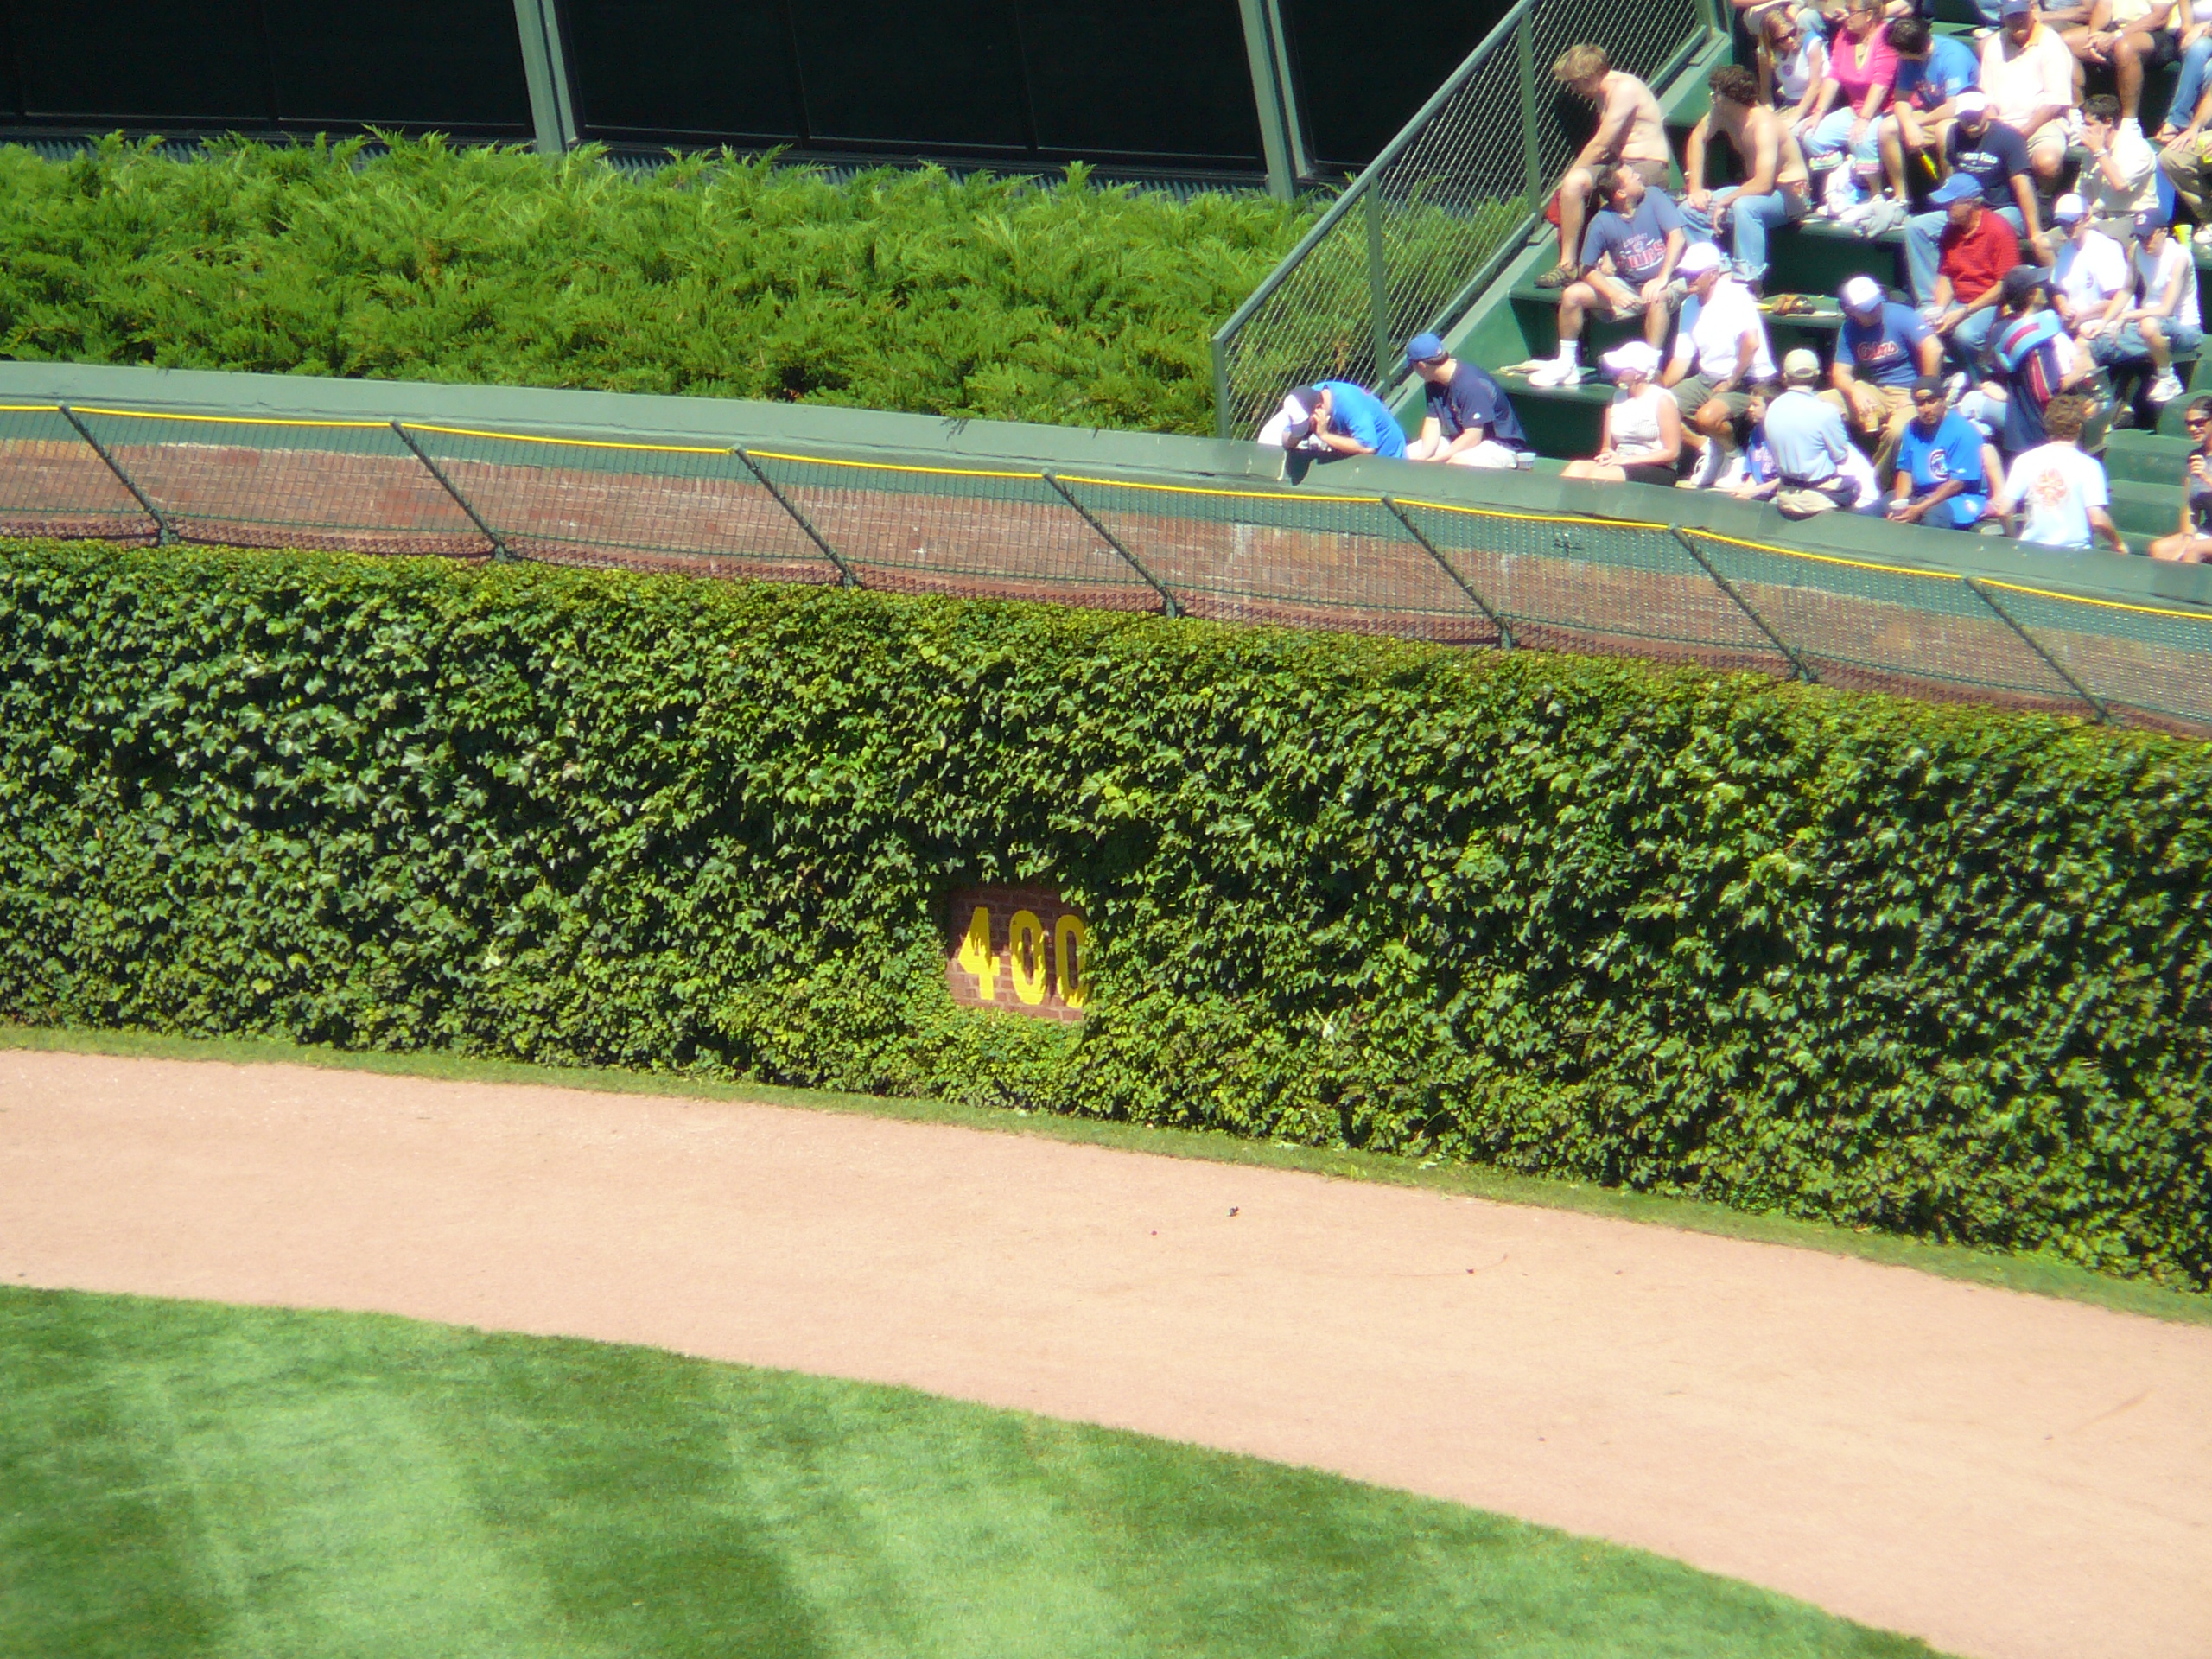
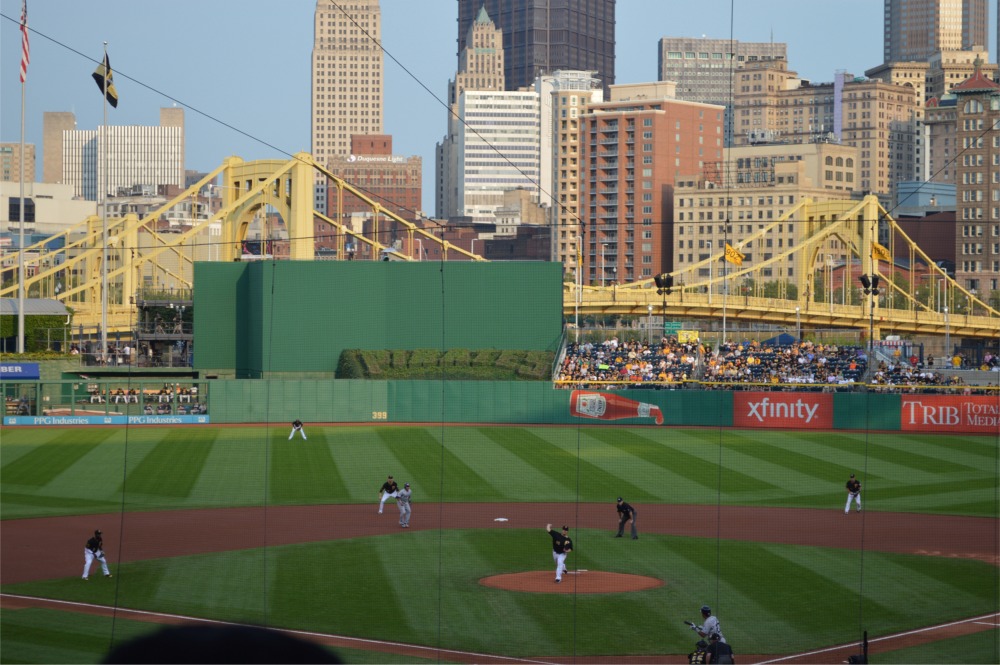
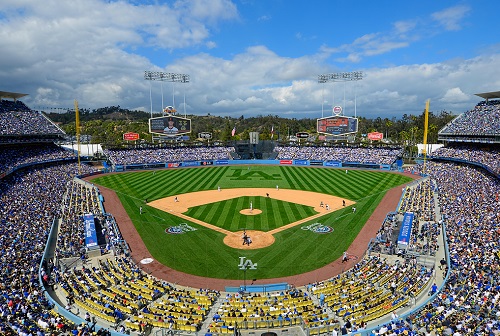
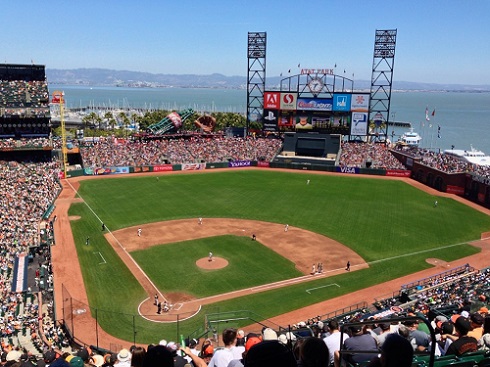
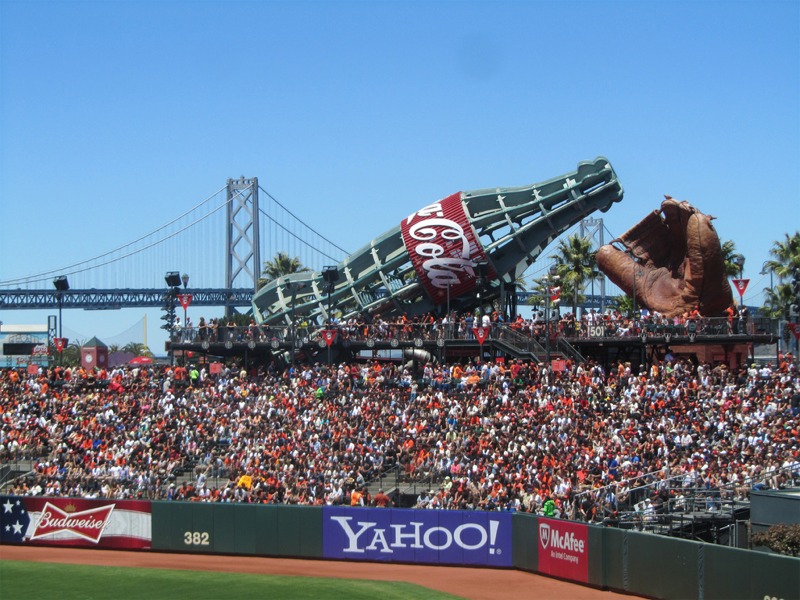
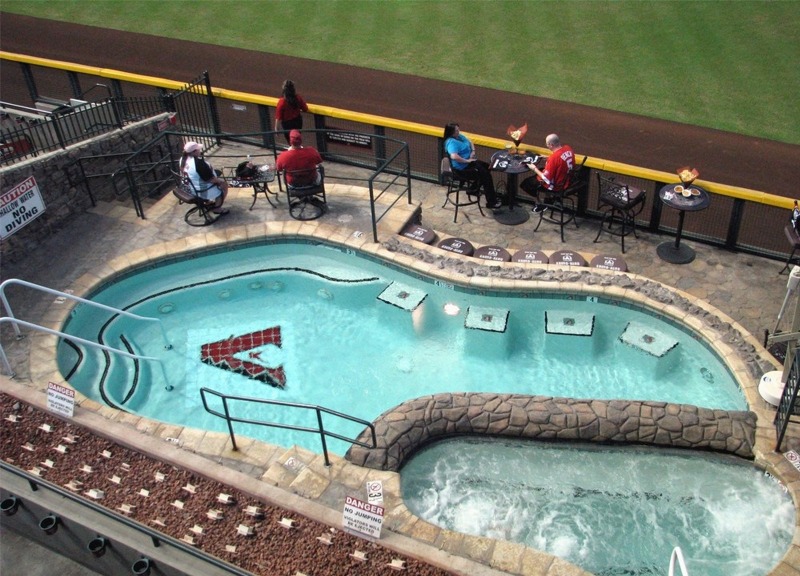
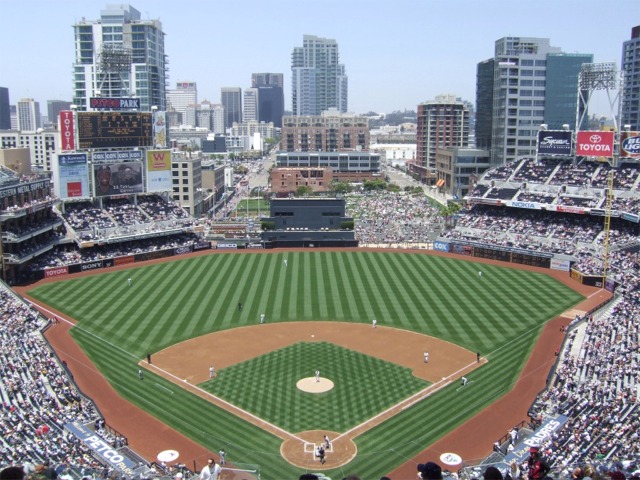
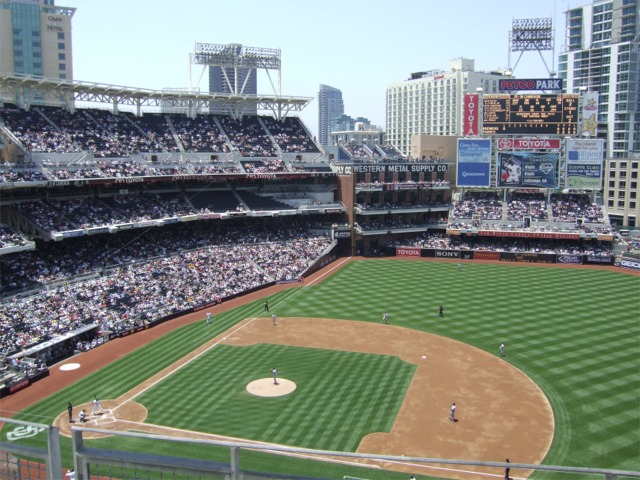
Started with all AL stadiums in Part 1, now lets go with the NL gang. The AL group may have gotten a little "fact-heavy", so this one may be a little shorter in the hopes of having more interesting facts. National League East New York Mets (Citi Field) - Part of a grand New York, New York double opening in 2009 (Yankee Stadium and Shea Stadium were both replaced that year), the exterior was built to evoke memories of old Ebbets Field, but did bring along one of the few beloved parts of Shea Stadium - the Home Run Big Apple. Washington Nationals (Nationals Park) - Nationals Park is a harder one to find anything interesting about without just punching in facts. On parkfactors.com, they note "The park has generic dimensions (337-377-402-370-335) and no special on-field elements" as well as being neutral for offense. The most interesting thing about Nationals Park is probably watching Bryce Harper play. Seriously, check him out. He's 22 and having one of the all-time seasons, living up to his SI cover at age 16. Philadelphia Phillies (Citizens Bank Park) - The Bank has been one of the most homer-happy stadiums in the league since it opened, though not for any particularly odd physical dimensions. It has a neon Liberty Bell that lights up and "rings" when the home team goes yard. Beyond this, it is yet another retro modern classic new build. Unfortunately for the local fans, the home 9 have been pretty dreadful the last couple of years, but that comes off of being a dominant team for about 5 years, so it's just your typical rebuild cycle that most non-Yankees and non-Cardinals fans have to deal with. Miami Marlins (Marlins Park) - This is the current newest stadium in the league, and was met with derision when it first opened, along with the teams brand new colours and all-new lineup (featuring Jose Reyes and Mark Buehrle...). The team was torn up by spendthrift owner Jeffrey Loria when they didn't immediately win (and I mean immediately, they started the rebuild mid-season). They feature a bizarre home run statue that many mock, though some people have said that it's actually pretty fun and artistic in person. Seriously though, take a good long look at that. It gets active... Oh, and there's also an aquarium behind home plate. Atlanta Braves (Turner Field) - Lets not spend too long on this field. Though it's less than 20 years old (it opened for the Atlanta Olympics), owners managed to convince local taxpayers to help fund a brand new stadium that is full of problems already. Quote from the great Grant Brisbee "The new Braves ballpark is a political shitstorm and a mockery of the democratic process." There are other small issues, including the fact that the main parking will be across a freeway from a stadium, and that the proposed pedestrian bridge to the stadium won't be ready when the stadium opens in 2017, and currently may never be opened. This just in (not at all just in), taxpayers funding stadiums is a terrible idea. National League Central St. Louis Cardinals (Busch Stadium) - Besides being home to the self-noted "Best Fans in Baseball", Busch is much like most of the new retro stadiums. You can see the famed "Gateway Arch" in the background, but the fans are generally watching the field, since the home team has been one of the consistently best teams in baseball for a long time. Chicago Cubs (Wrigley Field) - The second oldest stadium in the league, pretty much all fans are familiar with the famed ivy-covered outfield walls. The single-level outfield bleachers and the North-side neighbourhood location also let fans see in from the rooftops of neighbouring buildings. Traditionalists love the stadium, but many note that the amenities and facilities are badly lacking at this point (it is over 100 years old). Despite its age, it is not as old as the Cubs' last World Series title, but the lovable losers always seem to draw fans to the homey atmosphere. Pittsburgh Pirates (PNC Park) - A frequent top mention for most scenic stadium (along with upcoming AT&T), it also joints AT&T as having water near enough to the stadium to be reachable by home runs, though much less often than in San Francisco. Besides the Home Run Derby in 2006, only two players have reached the river on the fly, though a few have hit it after a bounce or two (and one home run landed in a boat). Milwaukee Brewers (Miller Park) - The house that Bud built (Selig, not Weiser), features a big yellow slide that their mascot Bernie goes down when the Brewers hit a home run (and on Mother's Day 2014, he went down with "his mother"...). Games also feature a "Sausage Race", and in 2003, Pirates player Randall Simon knocked down the Italian Sausage with a blow to the head (of the sausage only, Wikipedia assures us that the runner herself was not hit), and in the fall, the hot dog was taken down as well. The Polish Sausage stopped and helped them up so that all sausages could finish the race. Sometimes I have to work for the humour, but this is all just fact, my friends. There have since been a number of parodies, which I won't recap here, just check the Wiki link. Cincinnati Reds (Great American Ball Park) - Another waterfront stadium (it actually replaced Riverfront stadium), it is a little tougher to reach on the fly, as only one has ever gotten there. Beyond that, it has a (getting not-that-exciting) home run statue which gets lit up often (it is an extreme home run park). National League West Los Angeles Dodgers (Dodger Stadium) - The oldest stadium besides Wrigley and Fenway, it's still seen as a jewel thanks to the scenic locale. Vin Scully has been calling home runs there since it opened (and longer than that - he's finishing his 66th season now, and ready for one more next year). It's main features are mostly in its history, since it has hosted 8 World Series and a number of Cy Young winners (though that might be due largely to its offense-deadening ocean atmosphere). San Francisco Giants (AT&T Park) - Possibly the crown jewel of all the stadiums, AT&T sits on McCovey Cove and is very reachable by powerful left-handed hitters, though overall it is the hardest stadium in the league for hitters. 104 home runs have reached the water on the fly, 35 by one Barry Bonds. Nobody yet has hit the glove though. Colorado Rockies (Coors Field) - Hoping to mitigate the offense-heavy thin-air atmosphere a mile above sea level, the Rockies made the second-largest outfield in the league. Home runs still fly out of the yard though, and so do doubles and triples into the gaps. They have even taken to putting balls into a humidor to try to deaden them a bit, but it still plays to the hitters more than any park in the league by a wide margin. This is the park where pitchers' careers go to die. See Neagle, Denny (though for other reasons than just pitching), and Hampton, Mike among many others. Arizona Diamondbacks (Chase Field) - The second retractable roof stadium built, this one is primarily to keep the fans cool in the Arizona heat rather than protection from rain. If the roof and air conditioning still aren't keeping you cool, you can also relax in the pool just past the center field wall. Just watch out for long fly balls. San Diego Padres (Petco Park) - Last but not least. But not best either. The stadium, like the team, kind of moves along relatively unnoticed. Petco is a nice park that shows off the San Diego skyline well, and integrates an old warehouse like Camden. Like the other west coast stadiums, the heavy ocean air wreaks havoc on hitters, but does well for the pitching staff. Alright, that was all for now. I've gotten some more requests already, so thanks for reading, and check back in a few days maybe for more. By request of Joel, let's try to pick out an interesting feature of each MLB stadium. For purely physical dimension information of the ballparks, click here. For no particular reason, I'm going by division, just to put in separators. For information about park factors, check these out, and then I won't rehash too much.
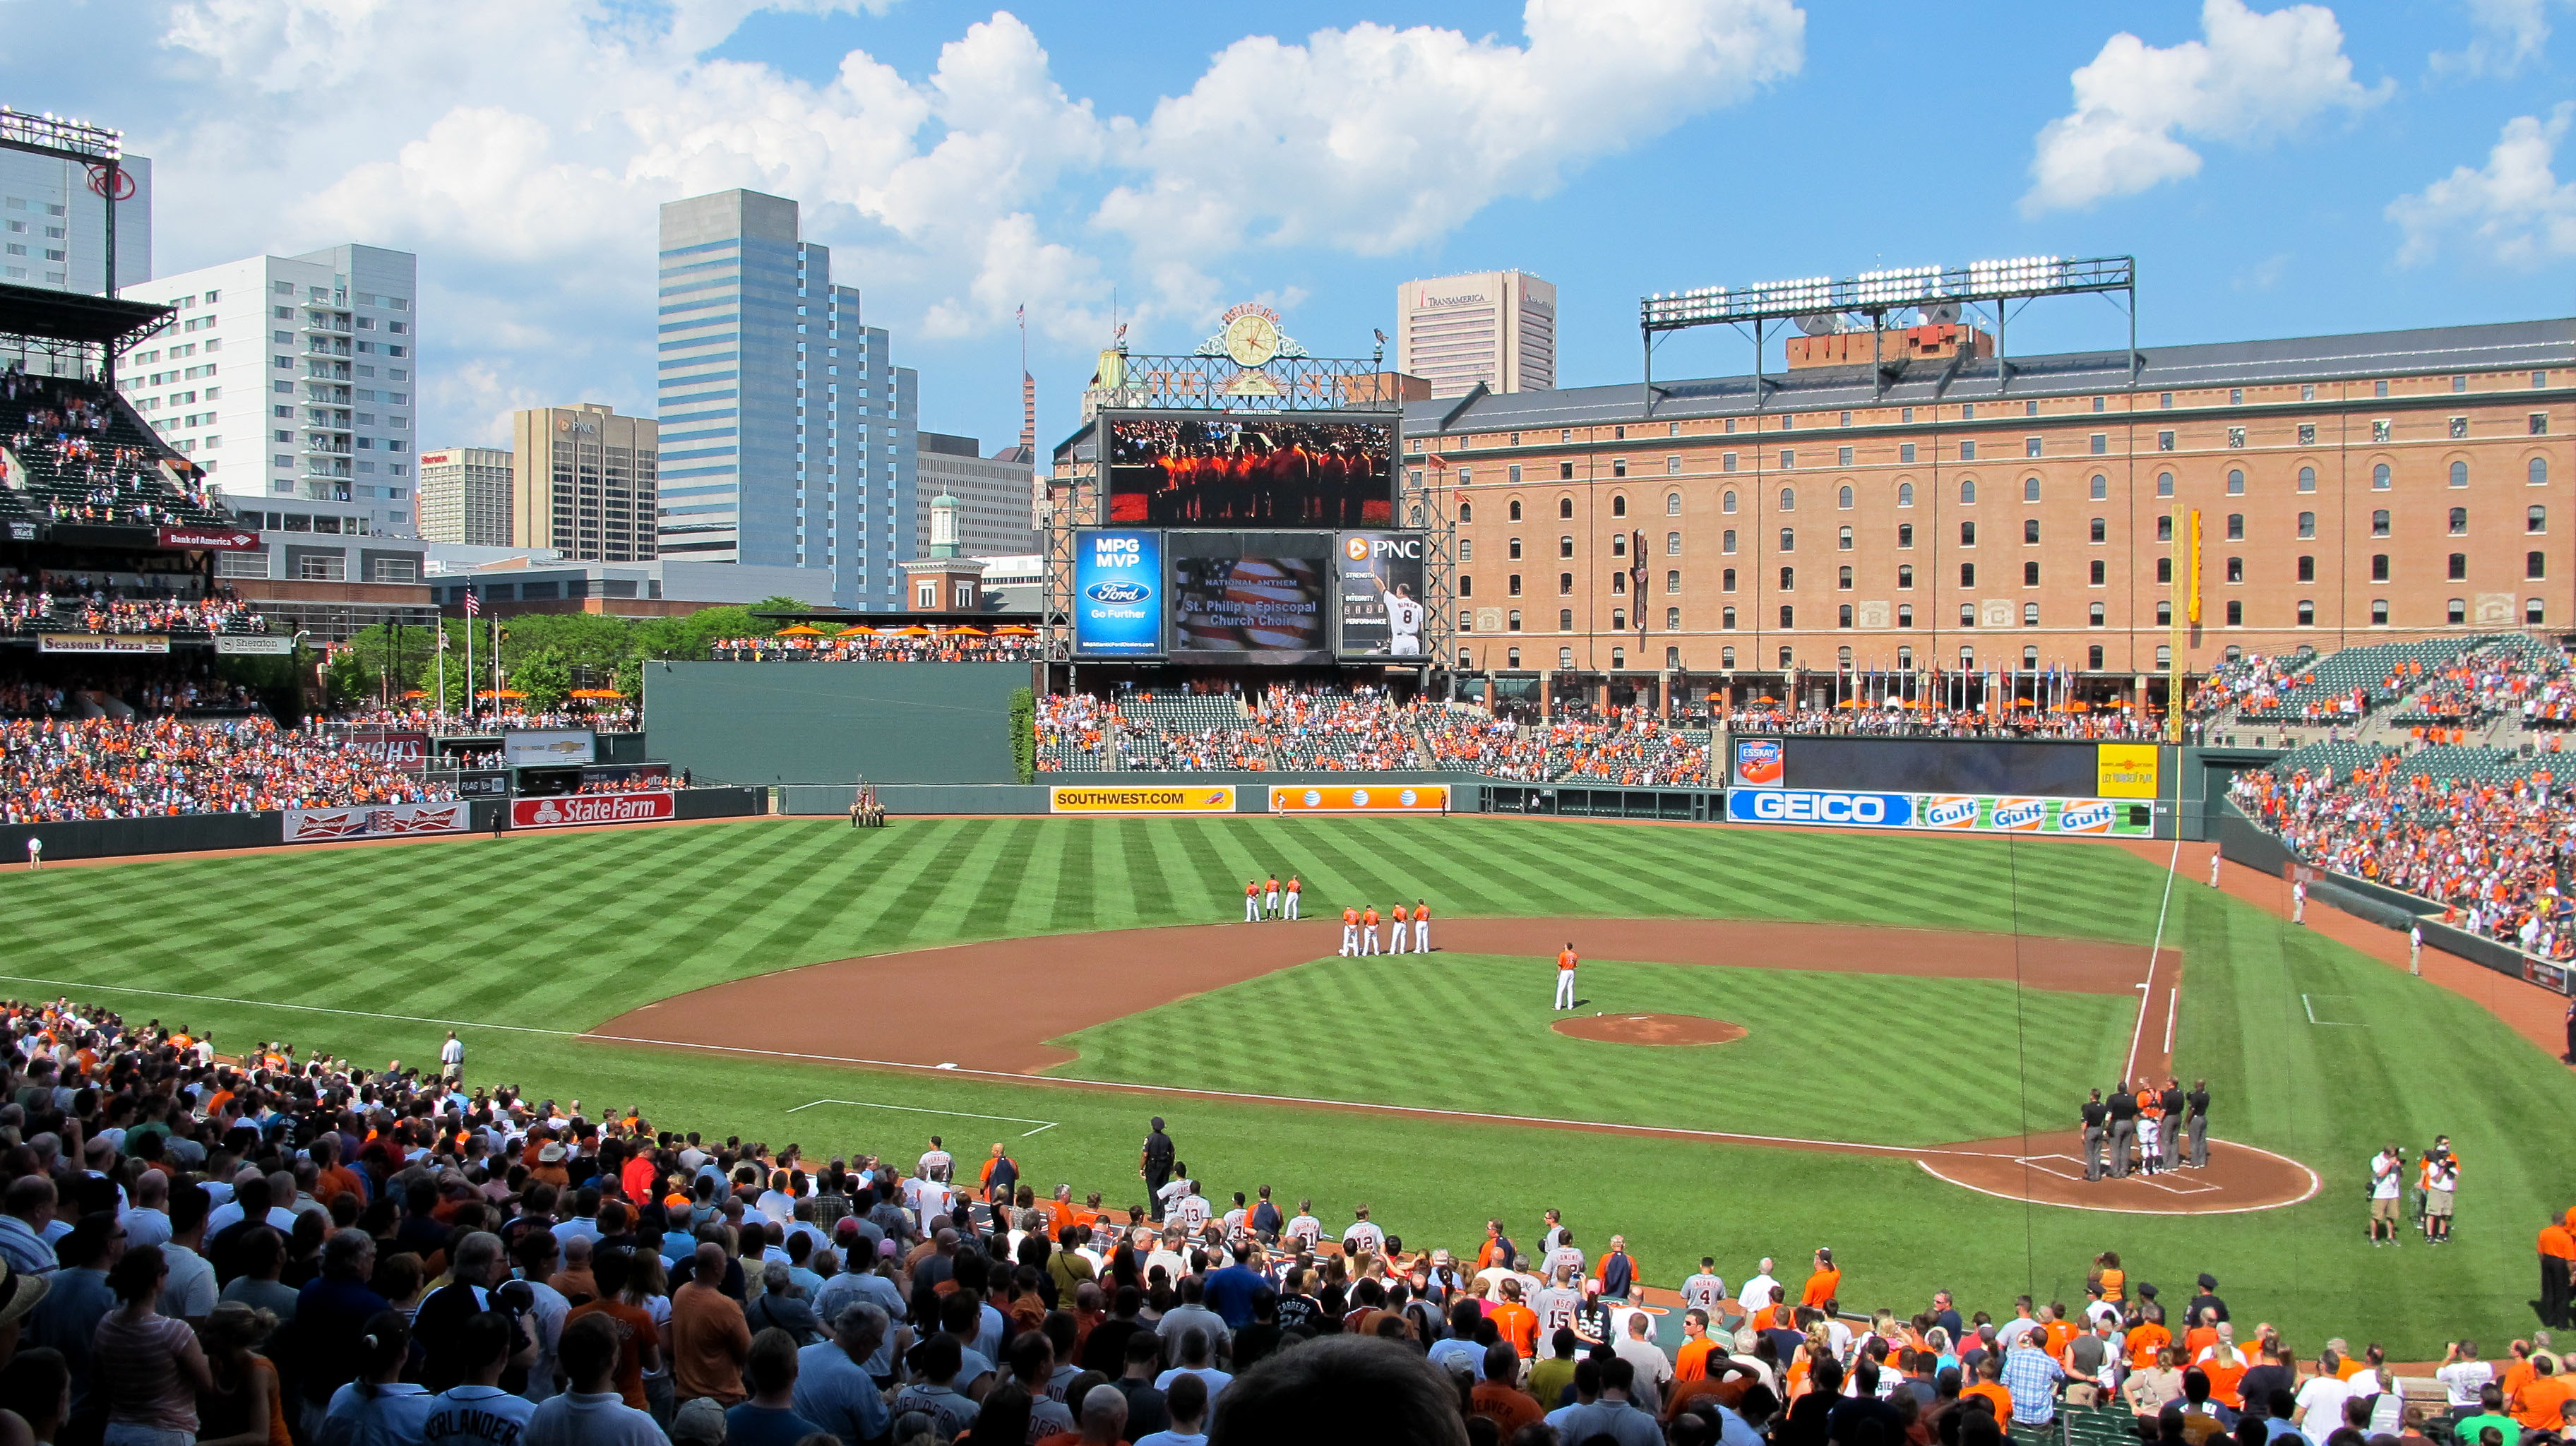
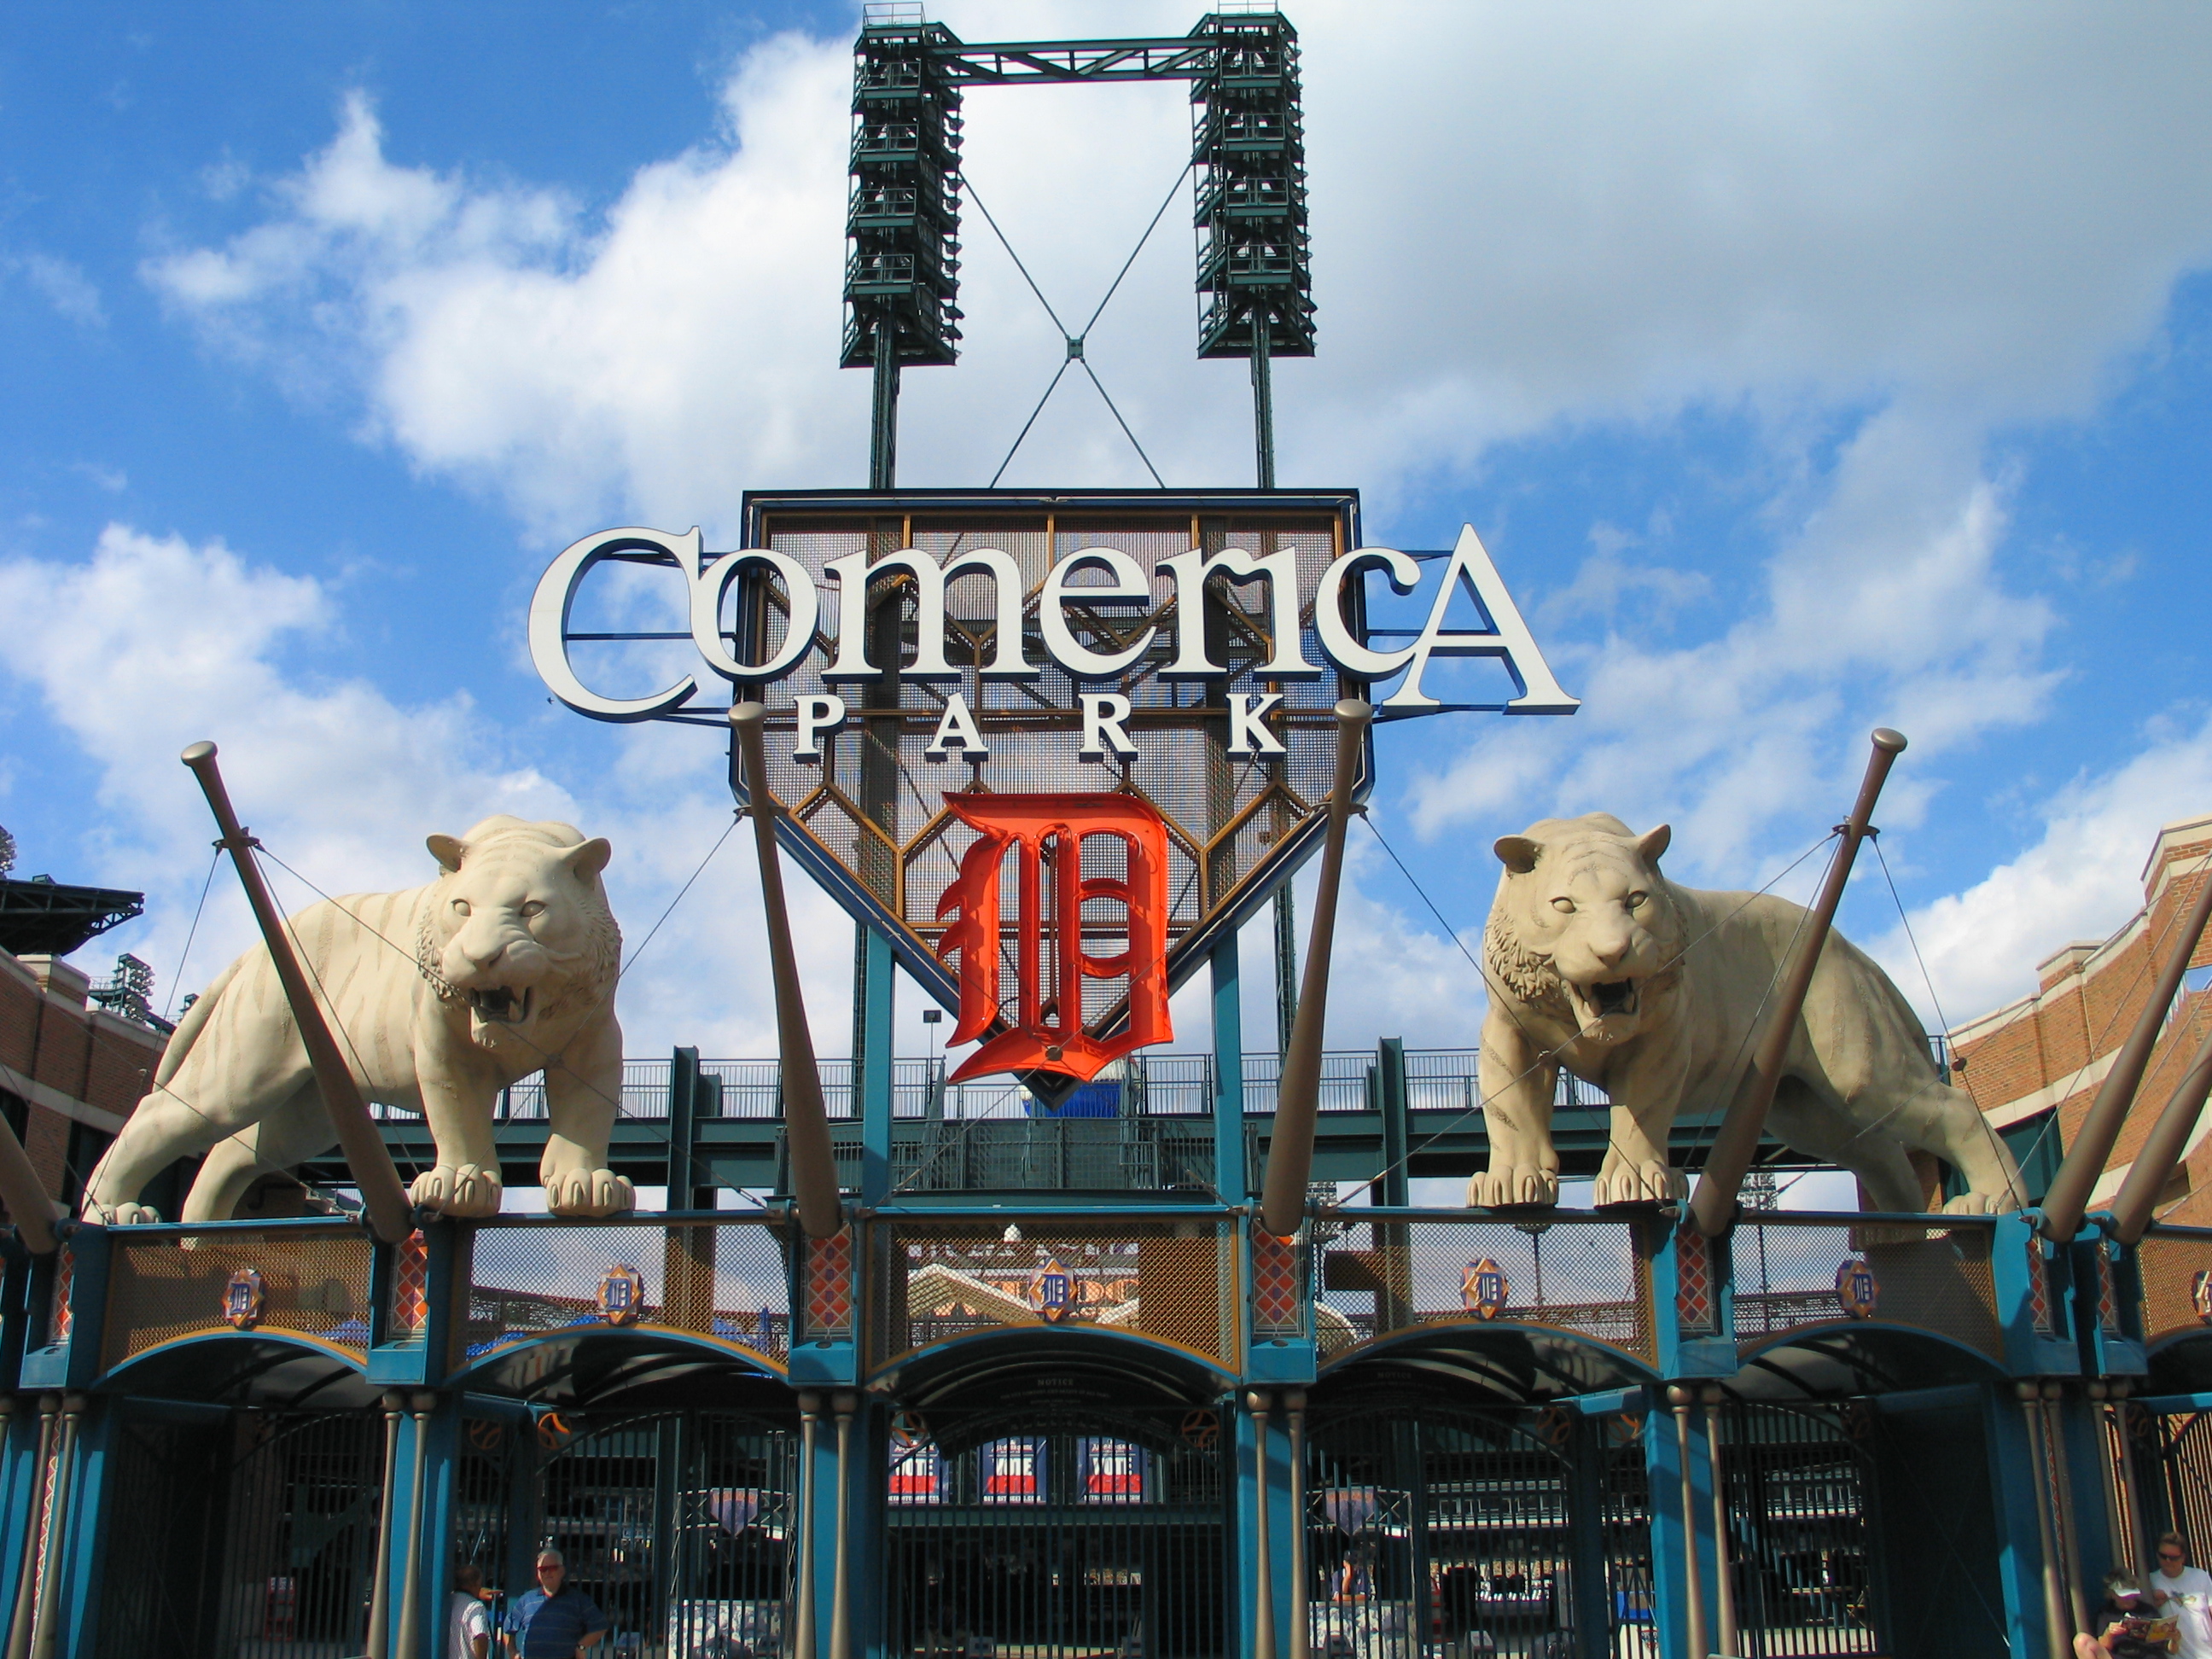
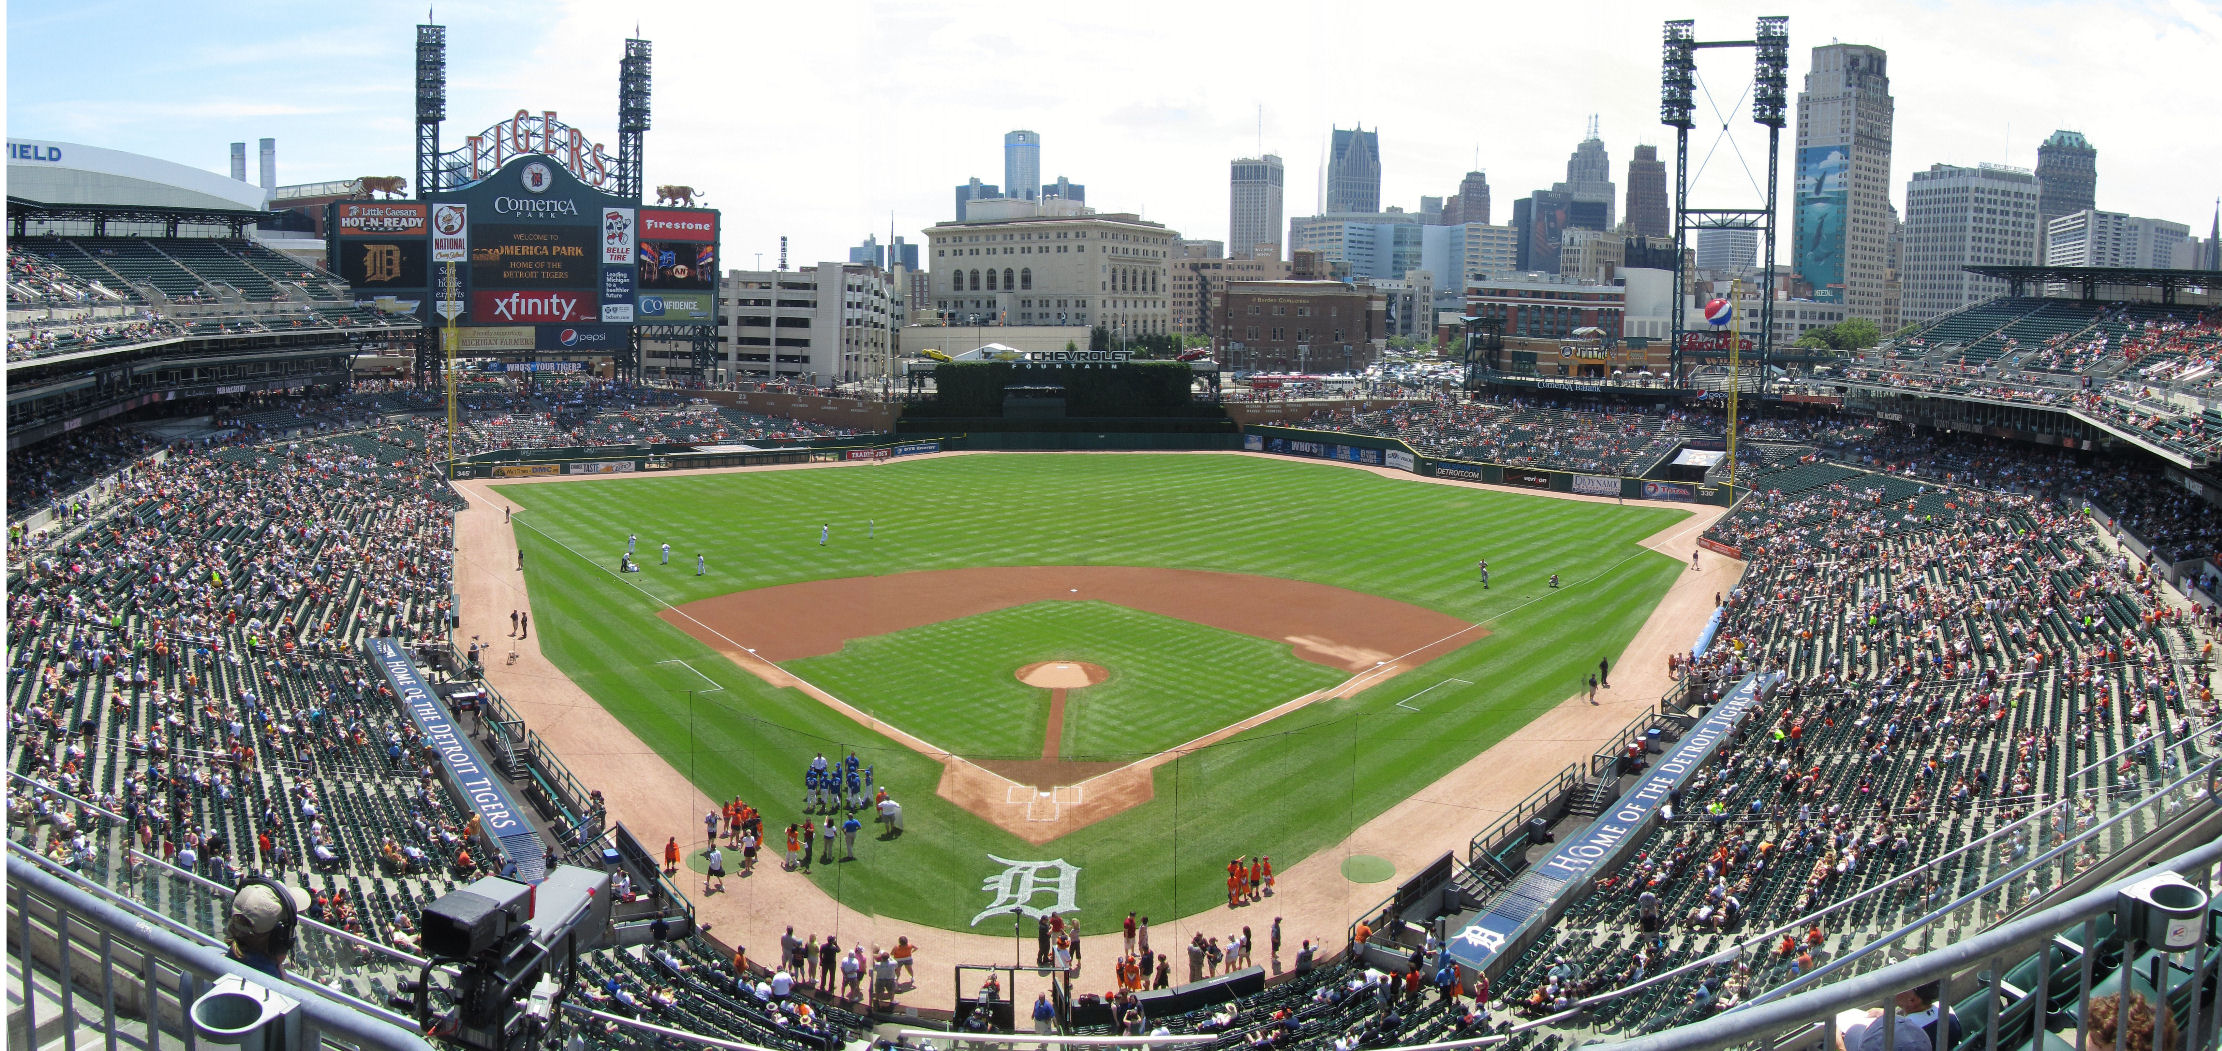
American League East Toronto Blue Jays (Skydome) - Start with the "team of the North", or whatever they're going with these days. Until this year, it was hard to remember that they had been the first team to hit 4 million fans in a season (which they did 1991-1993). But the fans do appear when the team is playing well, and their average attendance is up to 9th in the league so far. As far as the most unique feature of the Skydome (yes, lets keep calling it that), being the first stadium with a retractable roof. They are also one of only two stadiums now that don't have natural grass, though they're working on shortening that list to one. Tampa Bay Rays (Tropicana Field) - By most accounts the worst stadium in the league... there are a few interesting tidbits about it. Physically, at one point they did have a cutout in the left field wall. According to JP Morosi the team decided in 2007 that providing more opportunities for home run robberies for star left fielder Carl Crawford would be fun for the fans. And at that point, they hadn't provided much fun for the fans. It is visible in some pictures, though hard to specifically find in a search. Other tidbits include - the only stadium left with a non-retractable roof; the only other stadium with artificial turf, and at 31,042, by far the smallest seating capacity of any of the 30 stadiums (though Wikipedia notes that including the tarp covered seats, it can seat 42,735). New York Yankees (Yankee Stadium) - It is a little less unique now that they opened a new version in 2009. Some of its features include Monument Park (which was basically brought over from the old stadium. Checking out the physical dimension link from above, you can notice that their right field wall is way shorter than pretty much the other 29 stadia. Apparently from 2012-2014 an absurd 40% of left-handed hitters' fly balls went for home runs. Let's move on. Baltimore Orioles (Oriole Park at Camden Yards) - Camden was the first of the new "retro" fields built, which opened in 1992. Skydome had seemed like the hot new thing in 1989 with the retractable roof, but since then there has been a much more frequent move towards the more "classic" look. It is kind of the original hipster stadium. That being said, it is a better look than the Skydome. In terms of unique features, what comes up most often is probably the old warehouse beyond the right field bleachers. Integrating features of the city and skyline into the stadium in some way became popular with some of the new stadiums that came after this. And Ken Griffey Jr enjoyed it at the 1993 Home Run Derby. Boston Red Sox (Fenway Park) - A lot to pick from. The outfield alone gives a lot of quirks. It has the highest wall of all the stadiums (the famous Green Monster in left field) as well as the shortest wall of all the stadiums (the right field corner by Pesky Pole). It has the shortest left field line (310'), shortest right field line (302'), and shortest center field (390' - though it does jut out just right of center). All in all, the smallest fair territory of all the parks. That and it's the oldest stadium in the league, having opened in 1912. American League Central Kansas City Royals (Kauffman Stadium) - Kauffman has the largest fair territory of all the parks, which has been covered over the last year or two by the best outfield defense in the league. Of course, it's probably more famous for the fountains beyond left-center field. It was the last stadium that opened before Toronto's Skydome, with a surprisingly long 16-year gap between the two. For reference, in the 16 years after Skydome opened, 17 new stadiums opened (Tampa Bay, Chicago (White Sox), Baltimore, Cleveland, Texas, Colorado, Atlanta, Arizona, Seattle, Houston, Detroit, San Francisco, Pittsburgh, Milwaukee, Cincinnati, San Diego, Philadelphia). Minnesota Twins (Target Field) - The second newest park in the league doesn't have a lot of history, but does include one of the higher outfield walls (23' high in right field) which also has flower boxes on the top of that particular wall. The stadium it replaced was definitely quirky, but that's not what we're here for. They did put in a cool old-fashioned looking neon sign out beyond the wall. Detroit Tigers (Comerica Park) - Another new-ish stadium that replaced a fairly quirky classic. They do have some fun Tiger statues outside and along with many of the "modern retro" builds, do a good job of integrating the city skyline into the background. They also added a KC-like fountain in the outfield to go off when the home team hits a home run. Cleveland Indians (Progressive Field) - Another faux-retro stadium from the mid 1990's, then-Jacobs Field opened as the Indians started to actually play extremely well after a long period of mediocrity (which reached such depths that the movie Major League was focused on this franchise). In a data quirk, Wikipedia denotes Progressive as a Retro Modern stadium vs the Retro Classic that is Camden Yards. There are, in fact, 9 Retro Moderns, 12 Retro Classics, 3 Multipurpose, 1 Modern Retro Modern, 1 Modern Retro Classic, 1 Modern, 1 Contemporary, and 2 Jewel Box stadiums. Beyond that ballparksofbaseball.com notes that this is the only stadium with an associated retired number - 455, for the number of consecutive sellouts they had here from 1995-2001, a span that saw the Indians hit the playoffs 6 out of 7 years and lose twice in the World Series. This had ended a postseason drought of 41 years, so Jays fans don't have much to complain about yet. Chicago White Sox (U.S. Cellular Field) - The above noted "Modern Retro Classic" stadium opened after Skydome and the Trop, but before the explosion of new fields began. It's a bit of a non-descript park, which was criticized for not being in the style of the retro moderns/classics when Camden opened a year later. It seems to straddle the line of the old cookie-cutter bowl stadiums and the newer multi-dimensional stadiums. Due likely to the Windy City in which it resides, The Cell has ended up being one of the most extreme hitters parks in the league that isn't a mile above sea level. American League West Houston Astros (Minute Maid Park) - The Juice Box (nee Enron Field -- oops) replaced the "Eighth Wonder of the World" as the Astrodome was known. Leaving aside its birth name, Minute Maid features a number of physical quirks. Built at the site of an old train station, the left field wall beyond the grandstand features train tracks where a train rolls across the tracks for Astros home runs. The left field "Crawford Box" is the second shortest distance from home plate of any left field wall (315') after Fenway, but center field features the longest distance at 436' from home plate. Along with this distance, there is a 20 degree incline called Tal's Hill in center field with a flagpole in play. Texas Rangers (Globe Life Park in Arlington) - As much a hitters park as the Cell, Globe Life is affected by the hot, thin Texas air and has caused trouble for pitchers since it opened the same year as Progressive Field. Right field features a low-hanging covered grandstand in the style of old Tiger Stadium. The outside of the stadium features a brick architecture and is the only enclosed "retro" ballpark, with a 4-story office complex partially surrounding the field. Los Angeles Angels (Angel Stadium of Anaheim) - Angel Stadium is the 4th oldest stadium in the majors, with the 3 oldest all being seen as "true classics" (Fenway, Wrigley, Dodger). A big stadium with heavy coastal air, it is one of the most extreme pitchers parks in the league. It features a giant halo'd A outside the stadium and a rock pile and hedge garden beyond the outfield wall. Oakland Athletics (O.Co Coliseum) - Open as long as Angel Stadium, this still-multipurpose stadium is starting to come apart due to aging and sharing with the Raiders and their fans. Due to small crowds, huge swaths of seats are tarped off, reducing the seating to the second smallest capacity in the league at 35,067. With these seats open, O.Co would have the second largest capacity in the league at just under 56,000. Actively sharing the stadium with the NFL leads to some interesting views during September (and occasionally October) football games. "1st down, safe at second base". Oakland is attempting to build a new stadium in San Jose, but has been battling the Giants for territorial rights for several years. Seattle Mariners (Safeco Field) - Safeco has been the second toughest pitchers park in the league over recent years, which prompted changes to the physical dimensions of the field to try to help hitters out a bit. Unfortunately there isn't much to be done to help the heavy sea air in Seattle. Playing in the rainy Northwest demanded a retractable roof, to prevent frequent rainouts, though unlike the Skydome, the ballpark is covered but not enclosed. Alright, I was going to do all 30 in one post, but this is already at over 1600 words, so lets break it into the two leagues. |
Archives
November 2015
Categories
All
Greg JacksonA baseball fan in general. Interested in statistics and analytics. Usually follow the Giants and Blue Jays, fan of all MLB in general. |
 RSS Feed
